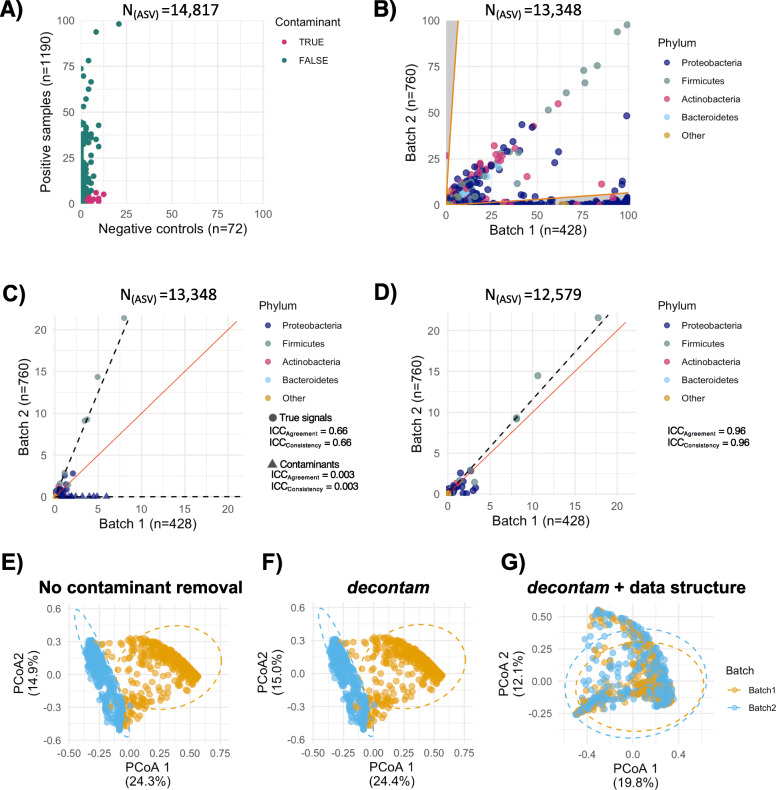
Fig. 2.
Two-tiered identification of potential contaminants and effects of their removal on batch variability. a Potential reagent contaminants were identified using the decontam package [13], which compared ASV prevalence between samples (n = 1190) and negative controls (n = 72). Two hundred fifty-six ASVs were identified as potential contaminant and removed. At this stage, unassigned ASVs, and ASVs belonging to the phylum Cyanobacteria, family of mitochondria and class of chloroplast (n = 780) were also removed. b Next, the data structure was used by between-batch comparison of ASV prevalence. We defined contaminants as any ASV with higher prevalence in one batch as would be expected in the other batch according to the standard error of prevalence calculated based on the batches’ sample size. The acceptable threshold is represented by the orange lines. Six hundred sixty ASVs below the orange lines were identified as potential contaminants. Quality control assessment of the data structure method was done on the between-batch comparison of ASVs (c) average relative abundances prior to and (d) after the removal of all potential contaminants. Relative abundances were re-calculated after the removal of the identified contaminants in panel d. There is high agreement and consistency in the relative abundance of “true” signals but not the contaminants. Removal of contaminants improved the between batch agreement and consistency of the remaining non-contaminant taxa. The solid red line represents a perfect correlation. The dotted line shows the linear association between average relative abundance values of batches. In panels b–d, each dot represents the average per batch. Next, batch variability was assessed e prior to contaminant removal, f after decontam, and again g after considering the data structure, i.e. taxa prevalence between the batches. The two-tier strategy eliminated the prominent separation of the samples on the PCoA plot assessed on Bray-Curtis dissimilarity. ASV, amplicon sequencing variant; ICC, intraclass correlation coefficient

