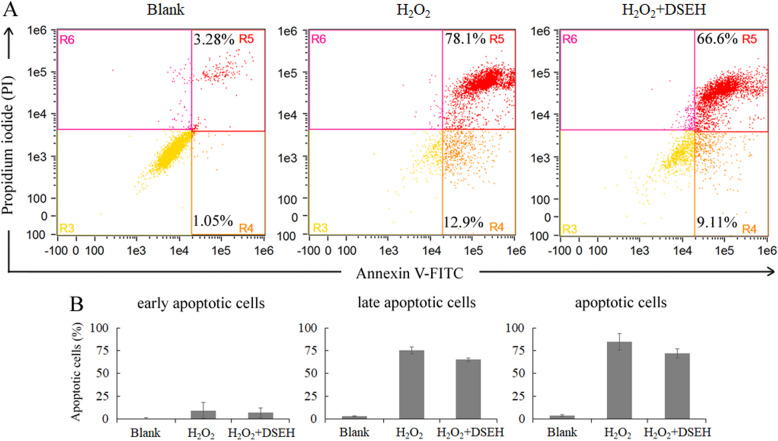
Fig. 6.
Effects of DSEH on cell apoptosis caused by H2O2-induced oxidative injury. Cell apoptosis was assessed by staining the cells with Annexin V and PI and performing on a flow cytometry instrument. In each graph, the lower left region (R3) represents viable cells (Annexin V (−) PI (−)); the lower right region (R4) represents early apoptotic cells (Annexin V (+) PI (−)); the upper right region (R5) represents late apoptotic cells (Annexin V (+) PI (+)); and the upper left region (R6) represents necrotic cells (Annexin V (−) PI (+)). H2O2: hydrogen peroxide

