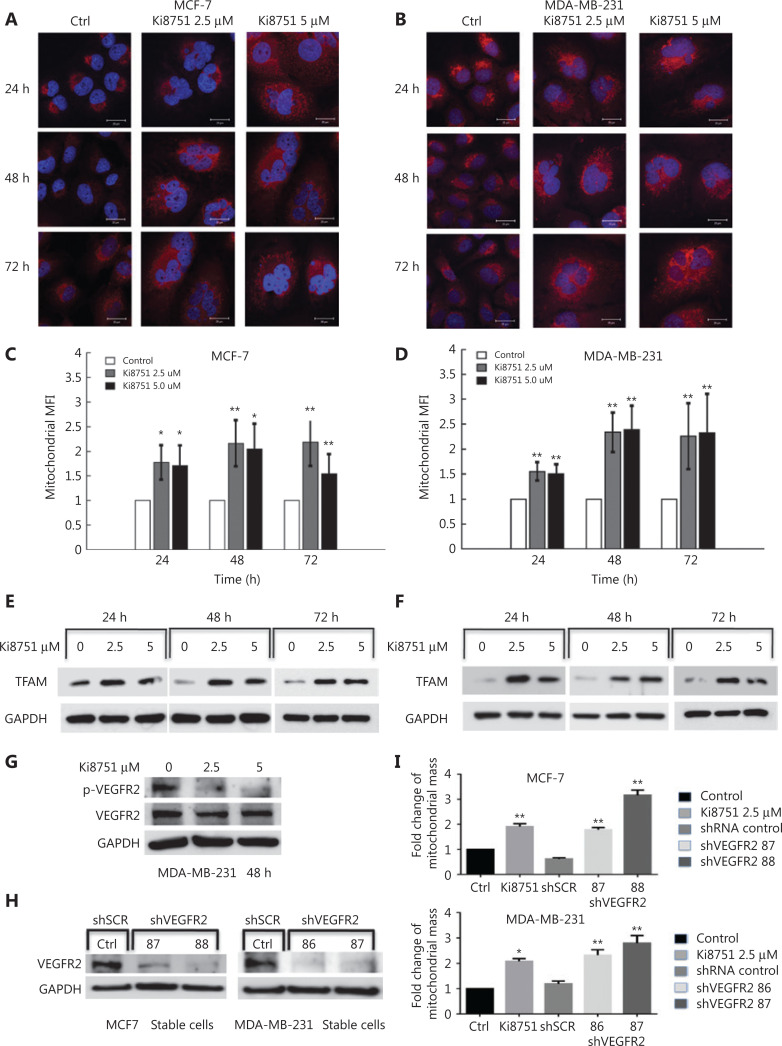
Figure 3.
Vascular endothelial growth factor receptor (VEGFR) 2 blockade by Ki8751 and VEGFR2 knockdown increases mitochondrial mass of breast cancer cells. The breast cancer cells, MCF-7 and MDA-MB-231, were cultured in a 6-well plate and in the presence of vehicle, 2.5, and 5 μM Ki8751 for 24, 48, and 72 h. Panels A and B: The breast cancer cells were stained with MitoTracker Red CMXRos for mitochondria and with 4′6′-diamidino-2-phenylindole for nuclei. Fluorescent images were acquired with a Leica TCS SP2 AOBS (Acoustico Optical Beam Splitter) inverted laser scanning confocal microscope equipped with a 63× water immersion objective. Representative images are from not less than three independent experiments. Panels C and D: The breast cancer cells were stained with 25 nM MitoTracker® Deep Red FM for 20 min at 37 °C in the dark. Mitochondrial fluorescence of the cancer cells were analyzed using a Beckman Coulter FC500 flow cytometer. *P < 0.05; **P < 0.01 as compared to the vehicle-treated controls. Panels E and F: Whole cell lysates of breast cancer cells were prepared using an EBC buffer (50 mM Tris at pH 8.0, 120 mM NaCl, 0.5% NP-40) containing protease inhibitors and phosphatase inhibitors. Samples containing the same protein amounts were separated by 10% SDS-PAGE and blotted onto nitrocellulose membranes. Western blot of mitochondrial transcription factor A (TFAM) was probed by anti-TFAM antibody, and glyceraldehyde 3-phosphate dehydrogenase (GAPDH) was used as the internal control (anti-GAPDH antibody). The results shown are representative images from 3 independent experiments. Panel G: MDA-MB-231 cells were cultured without or with Ki8751 for 48 h, and then harvested for Western blot of VEGFR2 (human VEGFR2/KDR/Flk-1 antibody) and phosphorylated VEGFR2 [phospho-VEGFR2 (Tyr951) antibody]. Panels H and I: MCF-7 and MDA-MB-231 cells were infected during 24 h with lentivirus expressing VEGFR2-targeted shRNAs at 86, 87, 88, or scrambled control. The cells were then selected for 7 days using puromycin (2 μg/mL). Afterwards, the cancer cells were harvested for Western blot of VEGFR2 expression and flow cytometric analysis of mitochondrial masses. Representative Western blot of VEGFR2 expressions in MCF-7 and MDA-MB-231 cells. (H). Fold changes of mitochondrial mass as compared to the control upon Ki8751 treatment or VEGFR knockdown are plotted (I); mean ± SEM, n = 3, *P < 0.05; **P < 0.01, as compared to the control.

