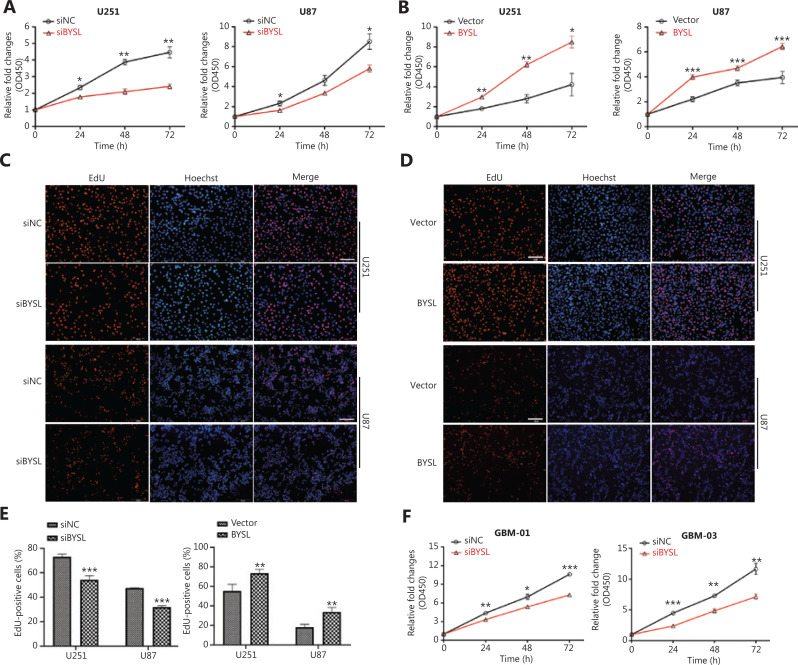
Figure 3.
The effects of BYSL downregulation or overexpression on glioma cell growth. (A, B) CCK-8 assays were used to measure the cell viability at 24, 48, and 72 h following BYSL downregulation (A) or overexpression (B) in U251 and U87 cells. (C–E) The 5-ethynyl-20-deoxyuridine (EdU) assays were performed to evaluate the cell proliferation in U251 and U87 cells. Representative images of BYSL downregulation and overexpression are shown in C and D, respectively. Scale bars: 200 μm. Quantitative analyses of the EdU-positive cells with BYSL downregulation and overexpression are shown in E. (F) CCK-8 assays were used to measure the cell viability in primary glioma cells at 24, 48, and 72 h following BYSL downregulation (*P < 0.05; **P < 0.01; ***P < 0.001).

