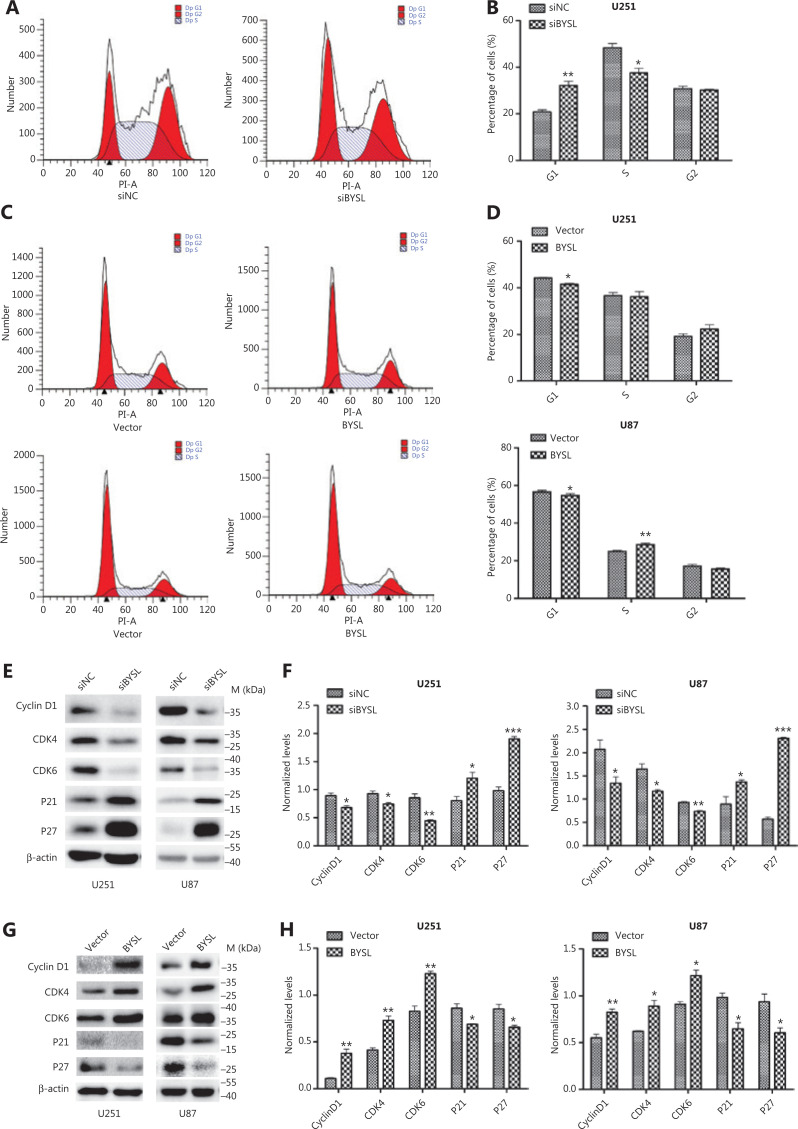
Figure 4.
The effects of BYSL downregulation or overexpression on cell cycle progression in glioma cells. (A–D) Flow cytometry was used to analyze the cell cycle progression in U251 and U87 cells. Representative histograms of BYSL downregulation and overexpression are shown in A and C, respectively. Quantitative analyses of the percentage of cells in G1, S, and G2 phases are shown in B (BYSL downregulation) and D (BYSL overexpression). (E–H) Western blot analysis was used to measure the changes in the cell cycle-related proteins in U251 and U87 cells. Representative blot images of BYSL downregulation and overexpression are shown in E and G, respectively. Graphs quantifying the blot images of BYSL downregulation and overexpression are shown in F and H, respectively. M, molecular marker (*P < 0.05; **P < 0.01; ***P < 0.001).

