Figure 1.
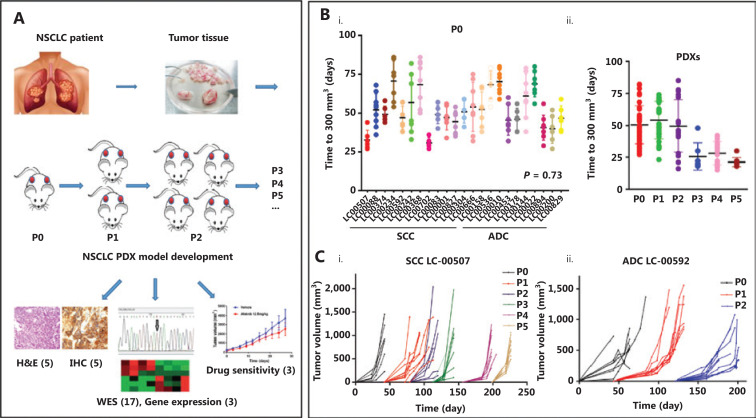
Patient-derived xenograft (PDX) tumor growth kinetics. (A) Illustration of non-small cell lung cancer PDX model development and characterization. (B) The scatter plot represents the time to tumor palpation (300 mm3) of the first generation (i) and passages 0–5 (ii) of 13 small cell carcinoma (SCC) PDXs and 10 adenocarcinoma (ADC) PDXs. (C) Tumor volume as a function of the days post-implantation of squamous cell carcinoma LC-00507 (i) and ADC LC-00592 (ii). Each color represents the specified generation and each curve represents a single tumor.

