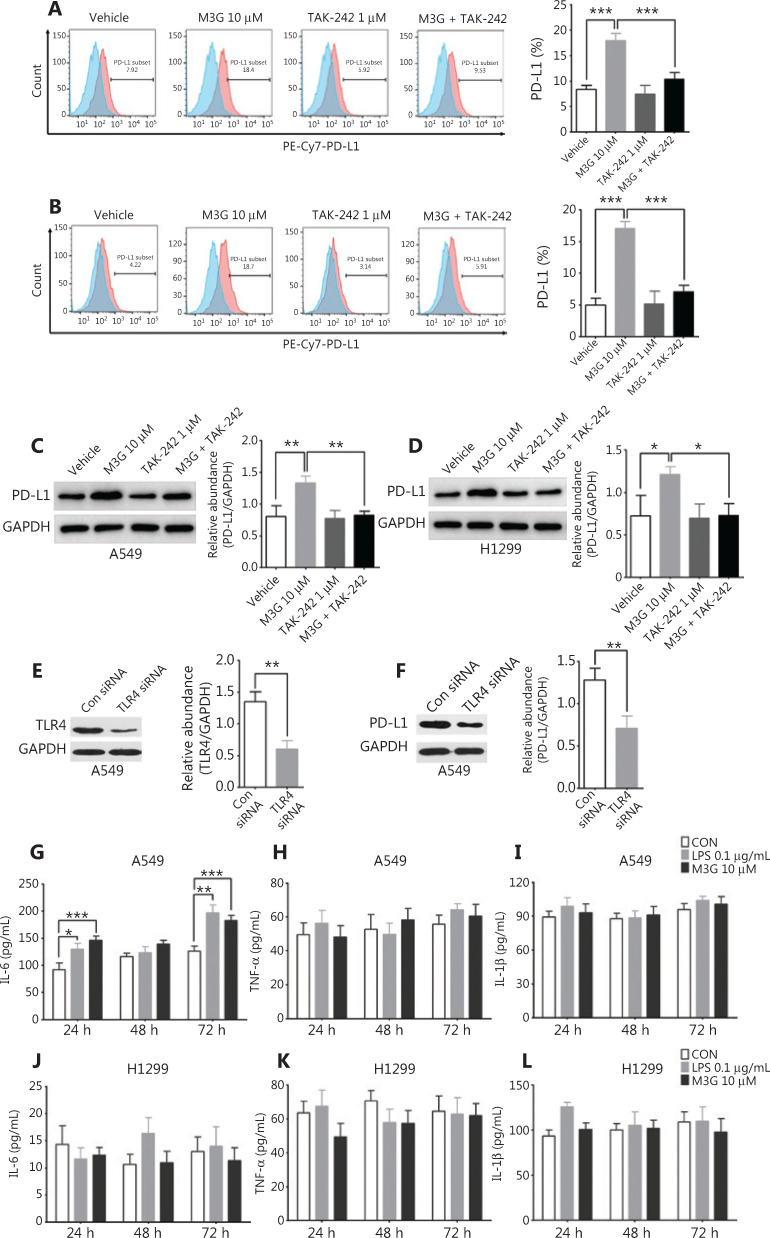
Figure 4.
M3G (morphine-3-glucuronide) upregulates PD-L1 expression through the TLR4 pathway. (A and B) Flow cytometric analysis indicating that M3G (10 μM) promotes PD-L1 expression in A549 cells (A) and H1299 cells (B) and that this process is reversed by combined treatment with TAK-242 (1 μM) and M3G, n = 3 cultures, respectively. (C and D) Western blot analyses showing that the M3G-mediated increase in the level of PD-L1 protein is abolished by TAK-242 treatment (1 μM) in A549 (C) and H1299 (D) cell lines, n = 3 cultures, respectively. (E) TLR4 siRNA can effectively knockdown the expression of TLR4 in A549 cells, n = 3 cultures. (F) Western blot analysis showing that TLR4 knockdown by siRNA inhibits the upregulation of PD-L1 caused by M3G; n = 3 cultures. (G) Co-incubation of the cells with M3G (10 μM) or LPS (0.1 μg/mL) for 24 and 72 h significantly increases the IL-6 levels in the culture medium of the A549 cells, n = 3 cultures. (H and I) Treatment with M3G (10 μM) or lipopolysaccharide (0.1 μg/mL) does not affect the secretion of TNF-α (H) and IL-1β (I) in A549 cells, n = 3 cultures, respectively. (J–L) Treatment with M3G (10 μM) or LPS (0.1 μg/mL) for 24 h, 48 h and 72 h does not change the concentration of IL-6 (J), TNF-α (K), and IL-1β (L) in the culture medium of the H1299 cells. Data are presented as the mean ± SEM. *P < 0.05; **P < 0.01; ***P < 0.001, one-way analysis of variance with Bonferroni’s post hoc test (A–D); two-tailed Student’s t-test (E, F); repeated-measures two-way analysis of variance with Bonferroni’s post hoc test (G–L).

