
Figure 10:
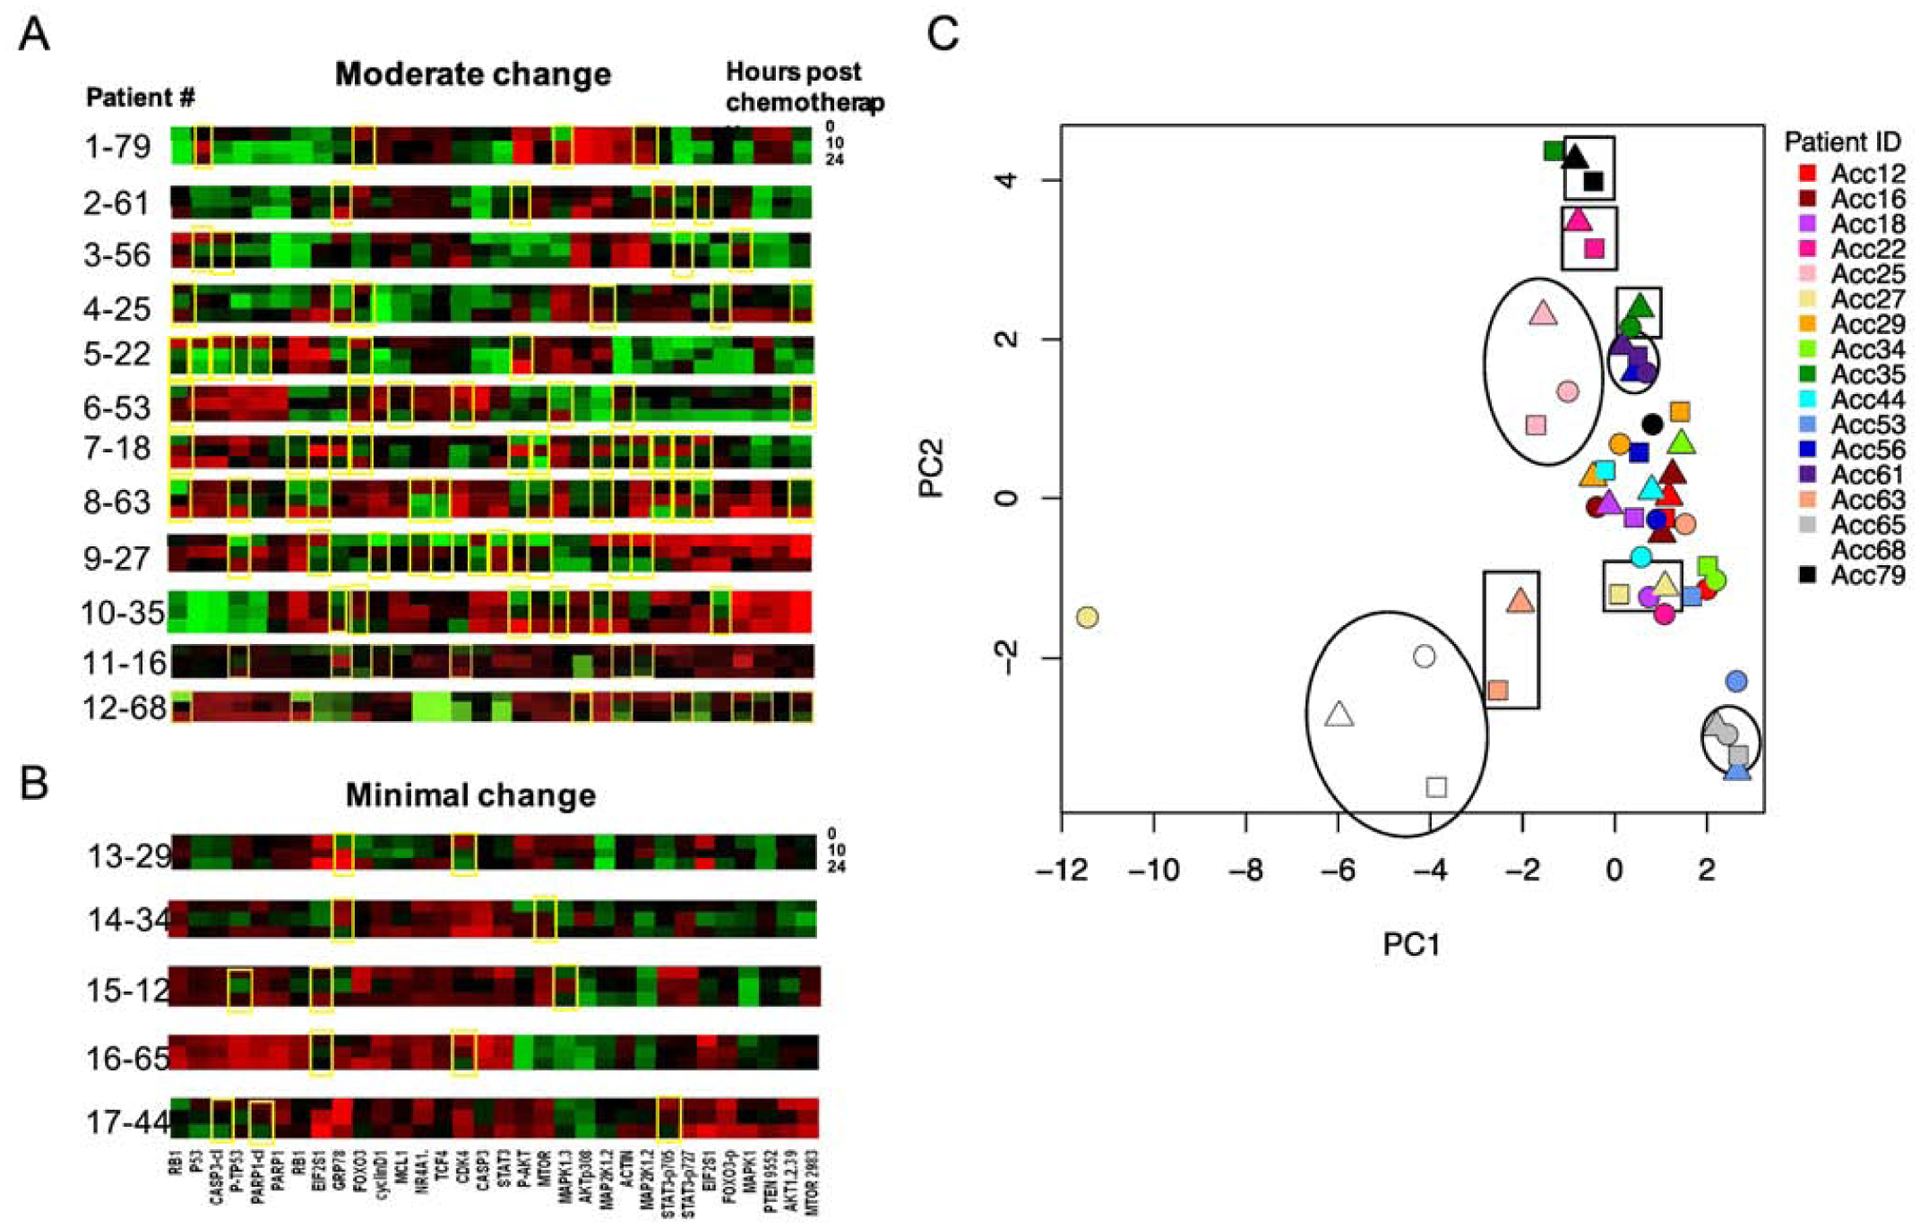
Protein expression profiles for 17 patients treated on the pediatric AML clinical trial AAML1031. A, B. Samples were collected from each patient prior to chemotherapy (0h, top line), 10h (middle line) and 24h (bottom line) following chemotherapy start. Protein expression profiles were compared at each time point. Patients with protein changes, either increased (red), or decreased (green) at 10 or 24h after treatment are noted by yellow boxes. A. Patients with frequent changes in protein expression over time (4 or more yellow boxes). B. Patients with little to no protein expression changes over time (three or fewer boxes). C. PCA analysis of protein expression by patient. Each patient was assigned a color and protein expression assessed pre-chemotherapy (circles), 10h post-chemotherapy (triangles) and 24h post-chemotherapy (squares). Representative samples with similar pre- and post-chemotherapy protein expression are noted by open circles/ovals; those with similar post-chemotherapy samples (10h and 24h) are noted by open squares/rectangles.