Figure 12:

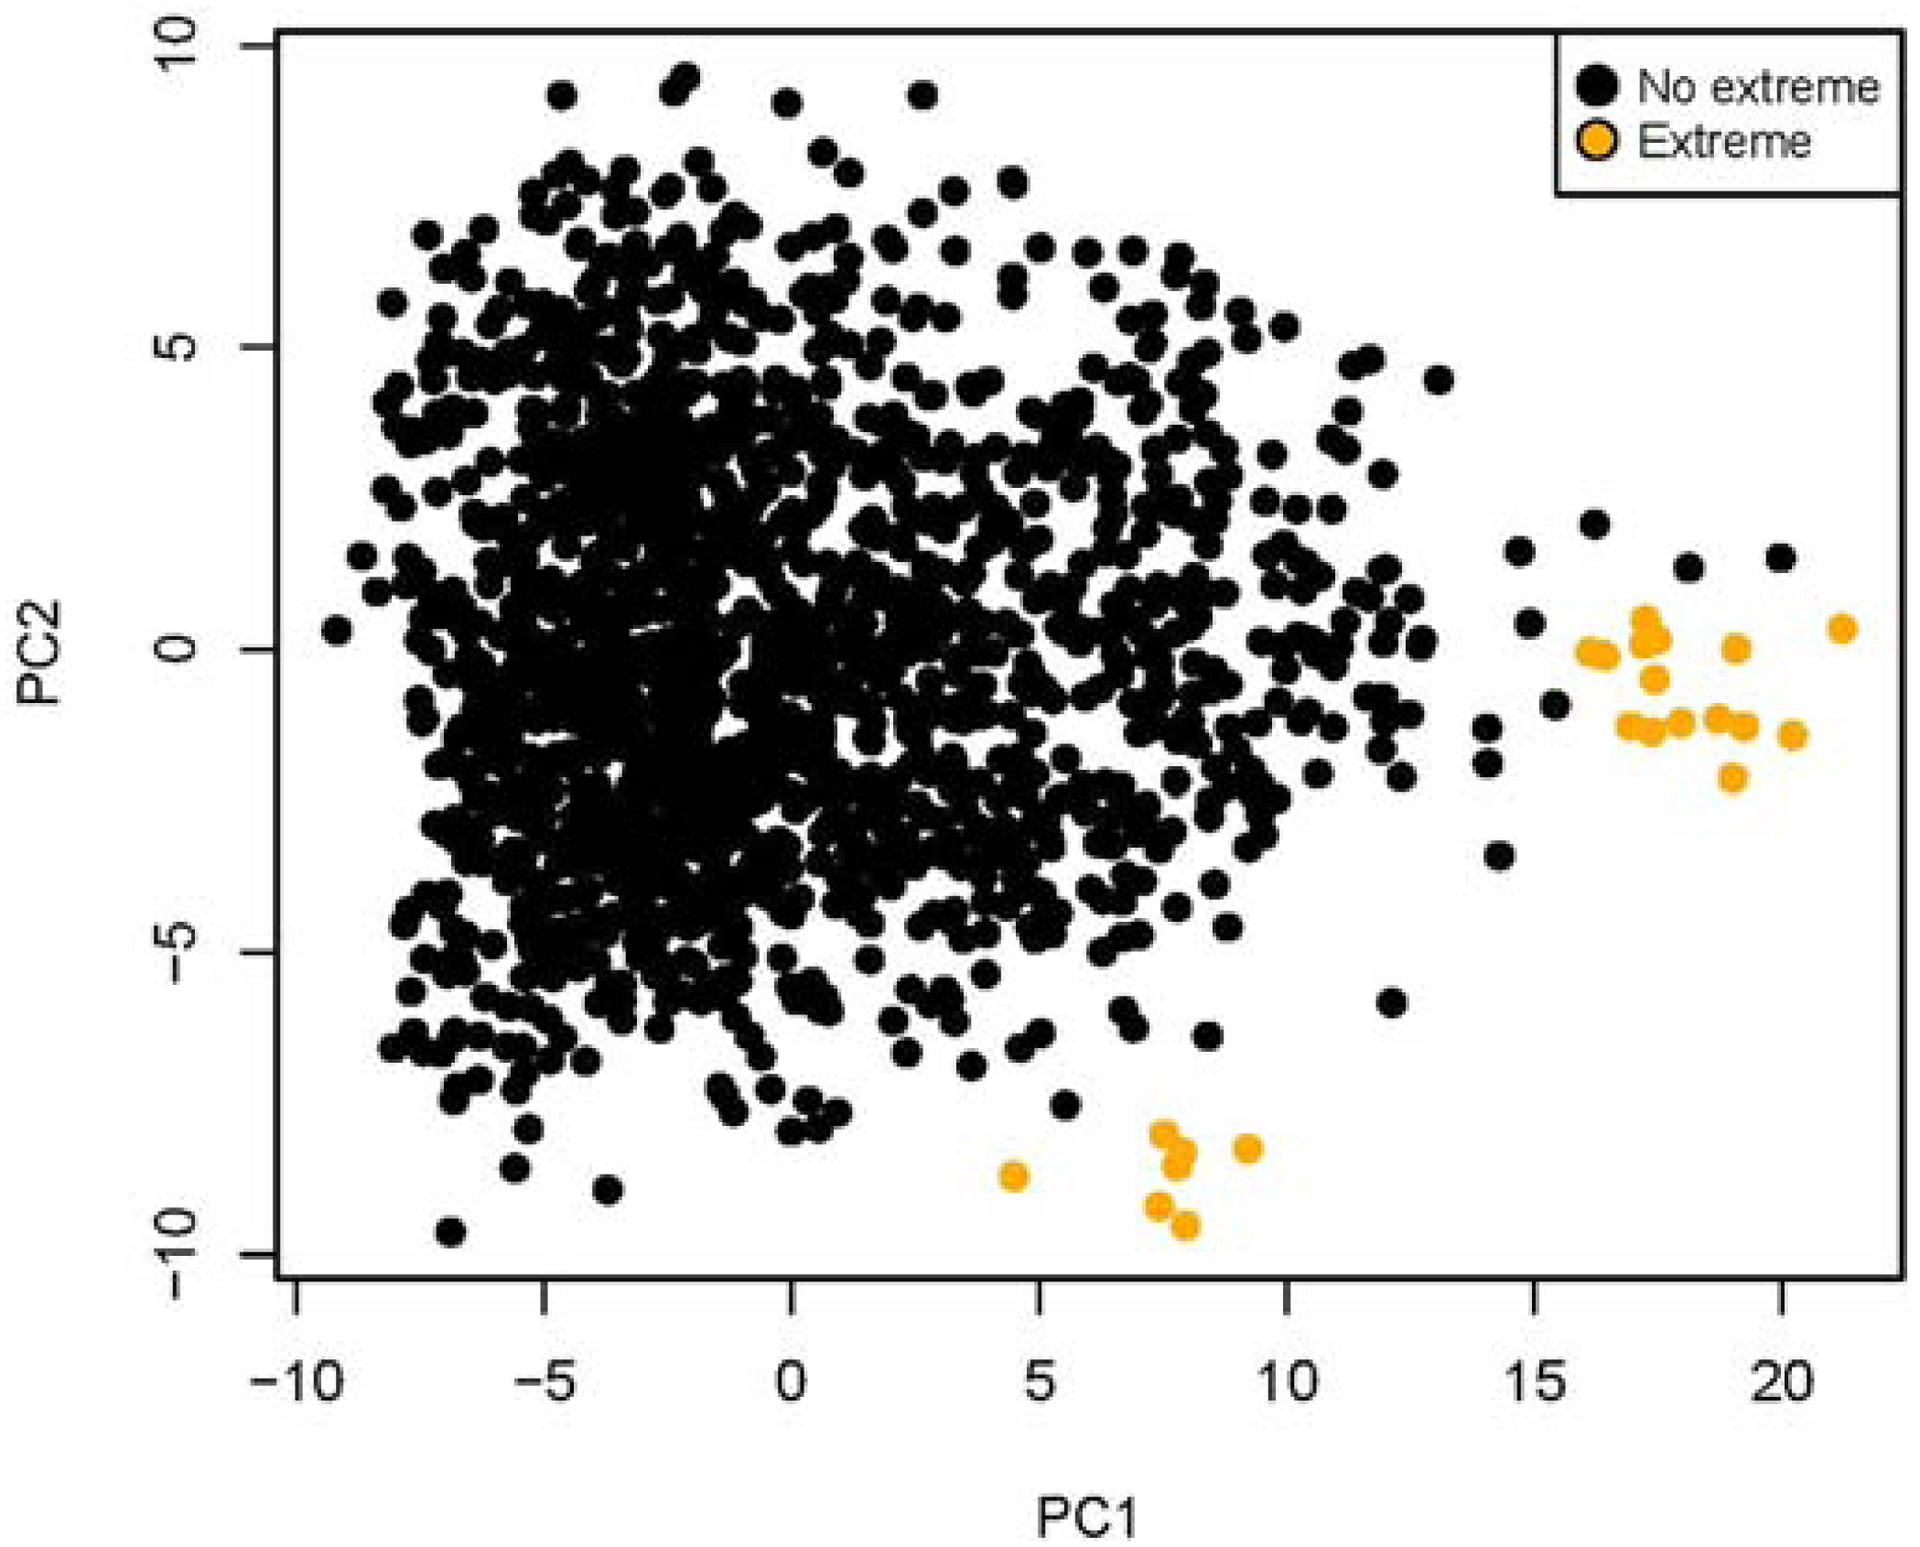
PCA analysis of protein expression in samples without protein extremes (black) vs those samples with the sum of protein extremes >60/295 (n=23/1515 samples; yellow). Samples with extremes clustered into two groups as shown.

PCA analysis of protein expression in samples without protein extremes (black) vs those samples with the sum of protein extremes >60/295 (n=23/1515 samples; yellow). Samples with extremes clustered into two groups as shown.