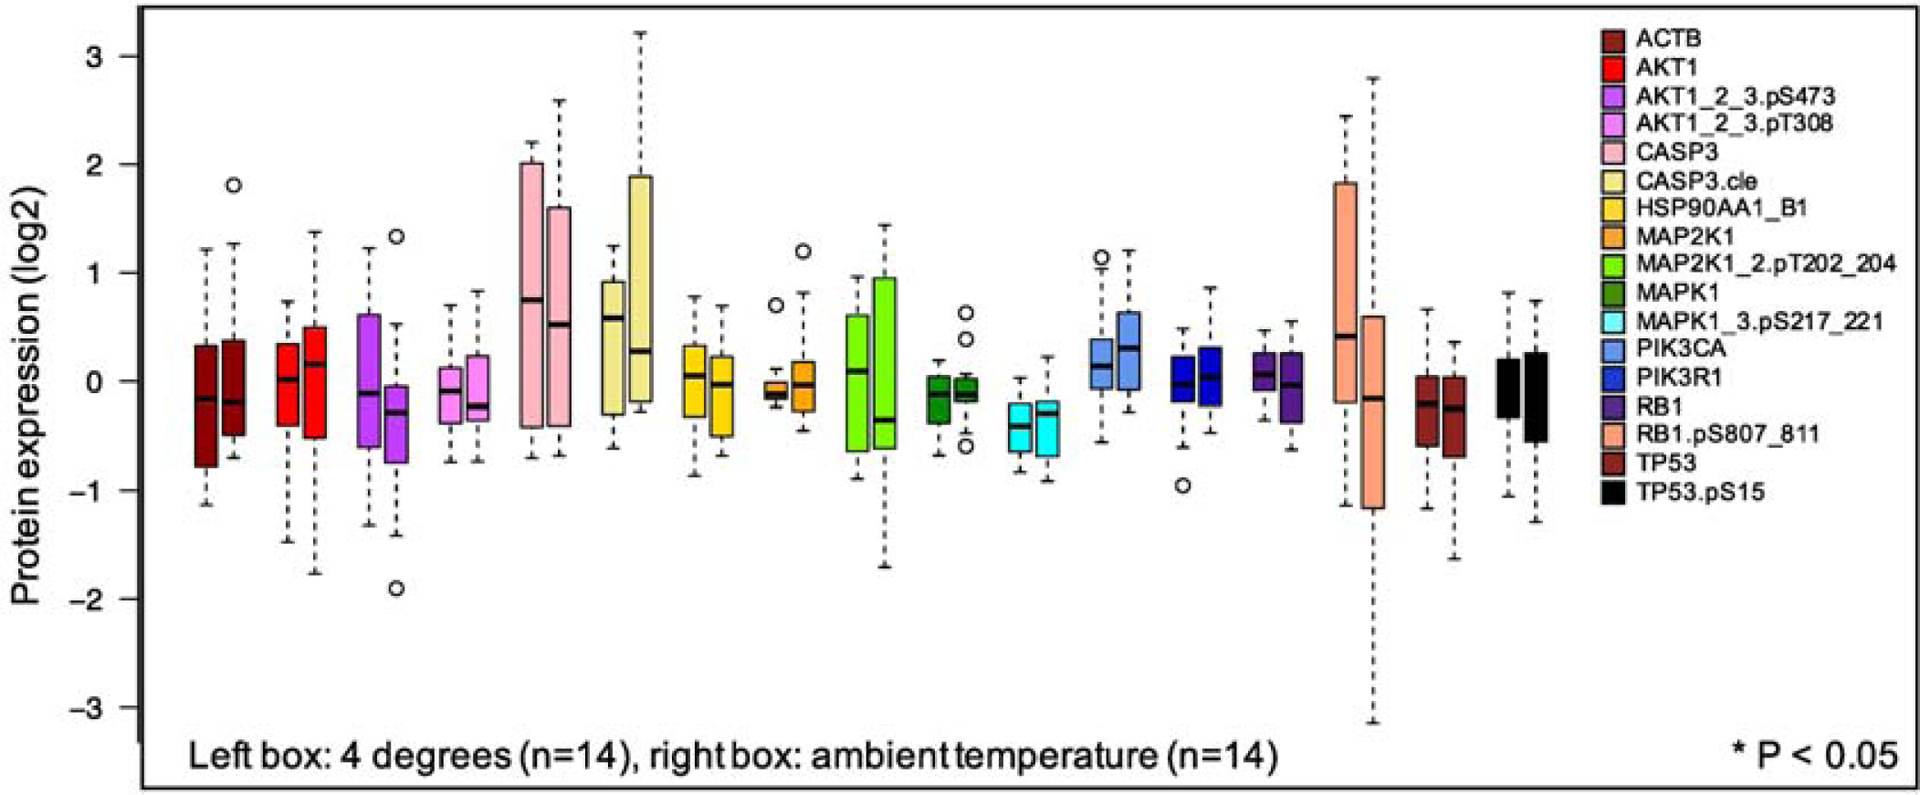
Figure 3:

Effect of temperature on protein concentration distributions. Seven primary pediatric AML comparing 4°C (Conditions 2 and 4) to ambient temperature (Conditions 3 and 5). Protein concentrations were measured for 17 antibodies as in Figure 2. Left bar represents each protein at 4°C (HELD + SHIPPED); right bar is the protein concentration distribution for ambient temperature (HELD + SHIPPED). There were no statistically significant differences at the p <0.05 threshold (Wilcoxon rank sum test, FDR corrected).
