
Figure 7:
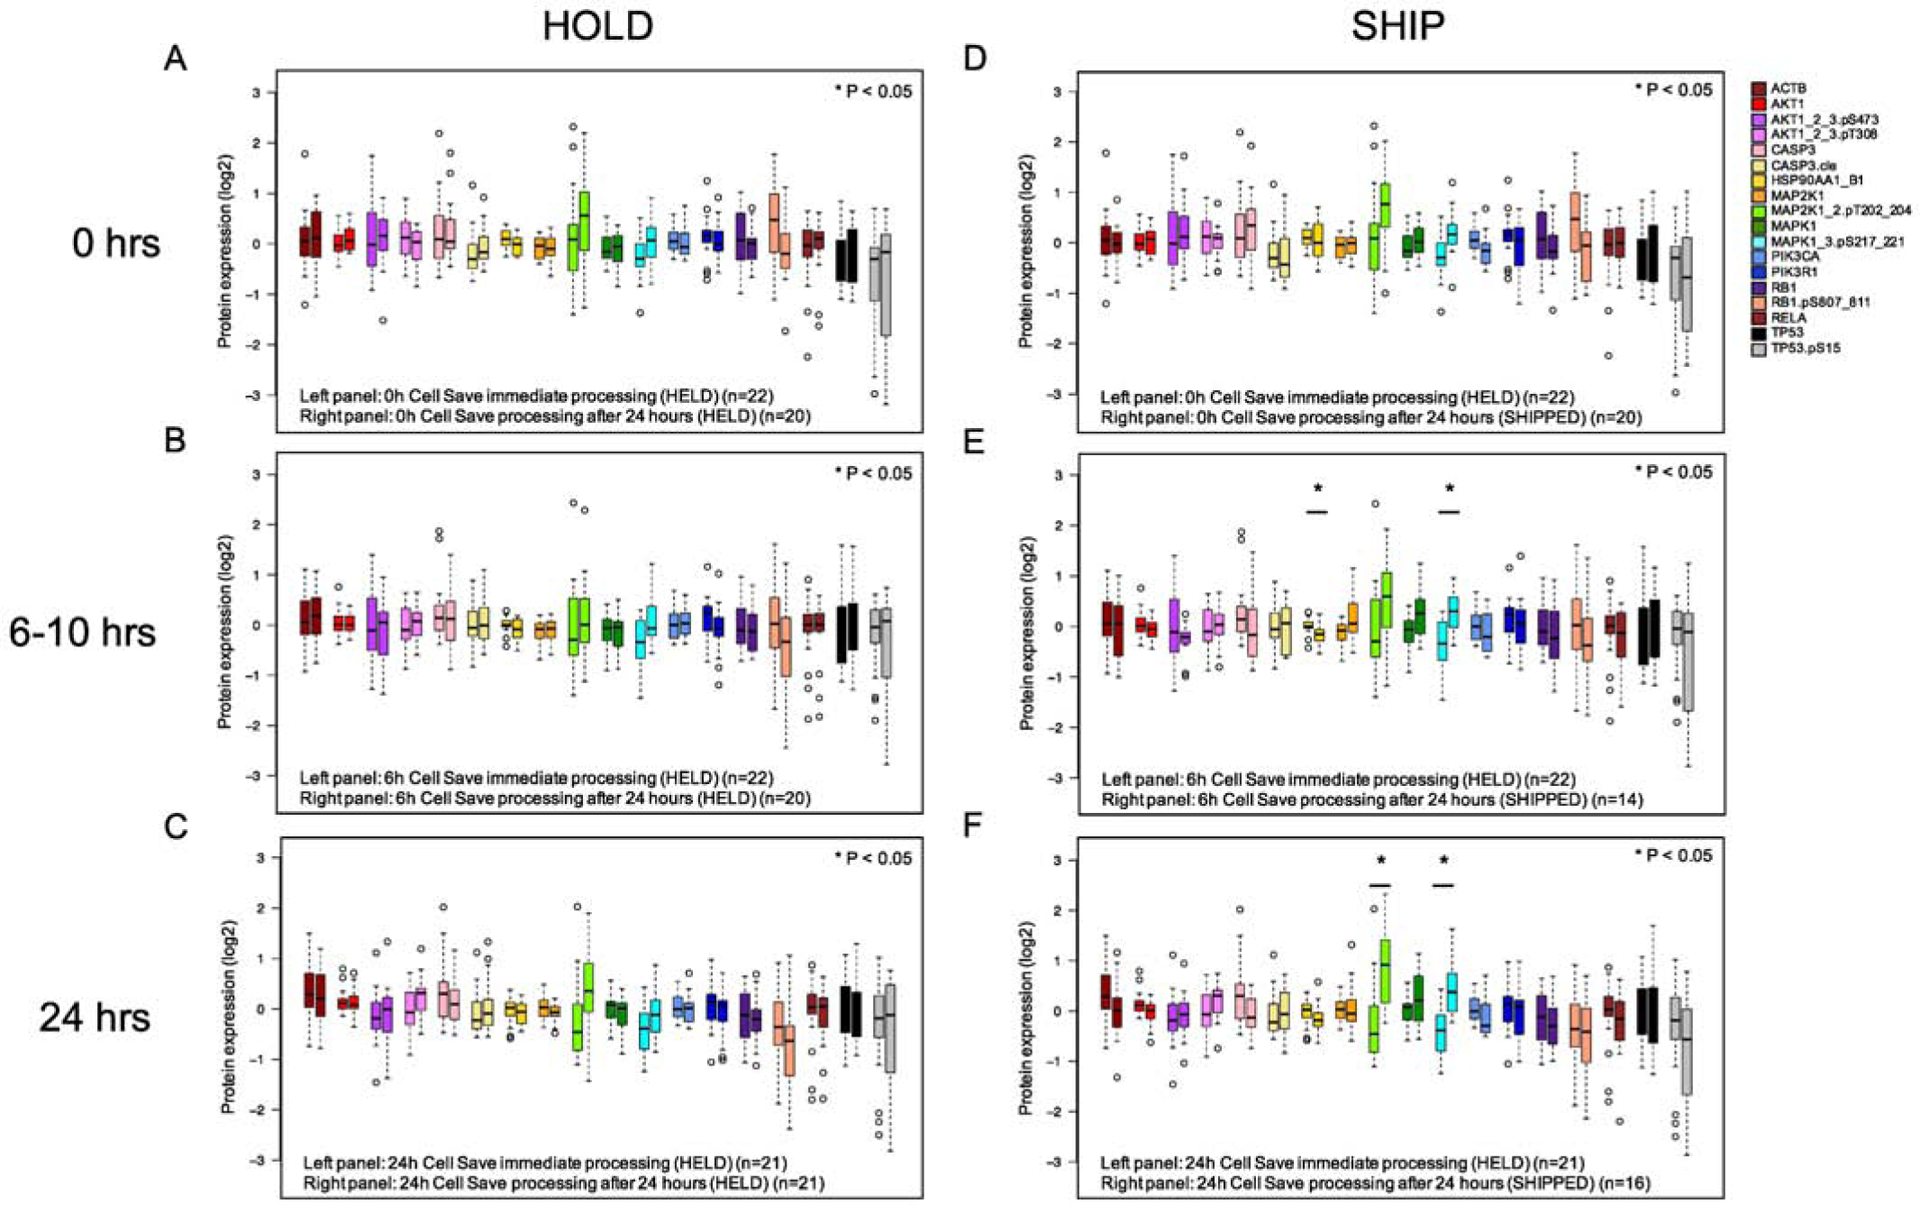
Effect of transit time on post-chemotherapy treatment protein concentrations. Blood samples from pediatric leukemia patients were collected in CS tubes and either processed immediately (left bar) or after ship/hold (right bar). A: Pre-chemotherapy samples processed immediately (n=22) vs after 24h (n=20) B: Samples were collected from patients 6h (ALL) or 10h (AML) after the start of systemic chemotherapy and processed immediately (n=22) and compared to either HELD (n=20) or SHIP (n=14). C: Samples were collected 24h after chemotherapy; immediate processing (n=21) was compared to HELD (n=21) or SHIP (n=16). Samples outside the 25–75% intervals are noted with open circles. Significant differences (p<0.05) as determined by Kruskal-Wallis are denoted by an asterisk.