
Figure 8:
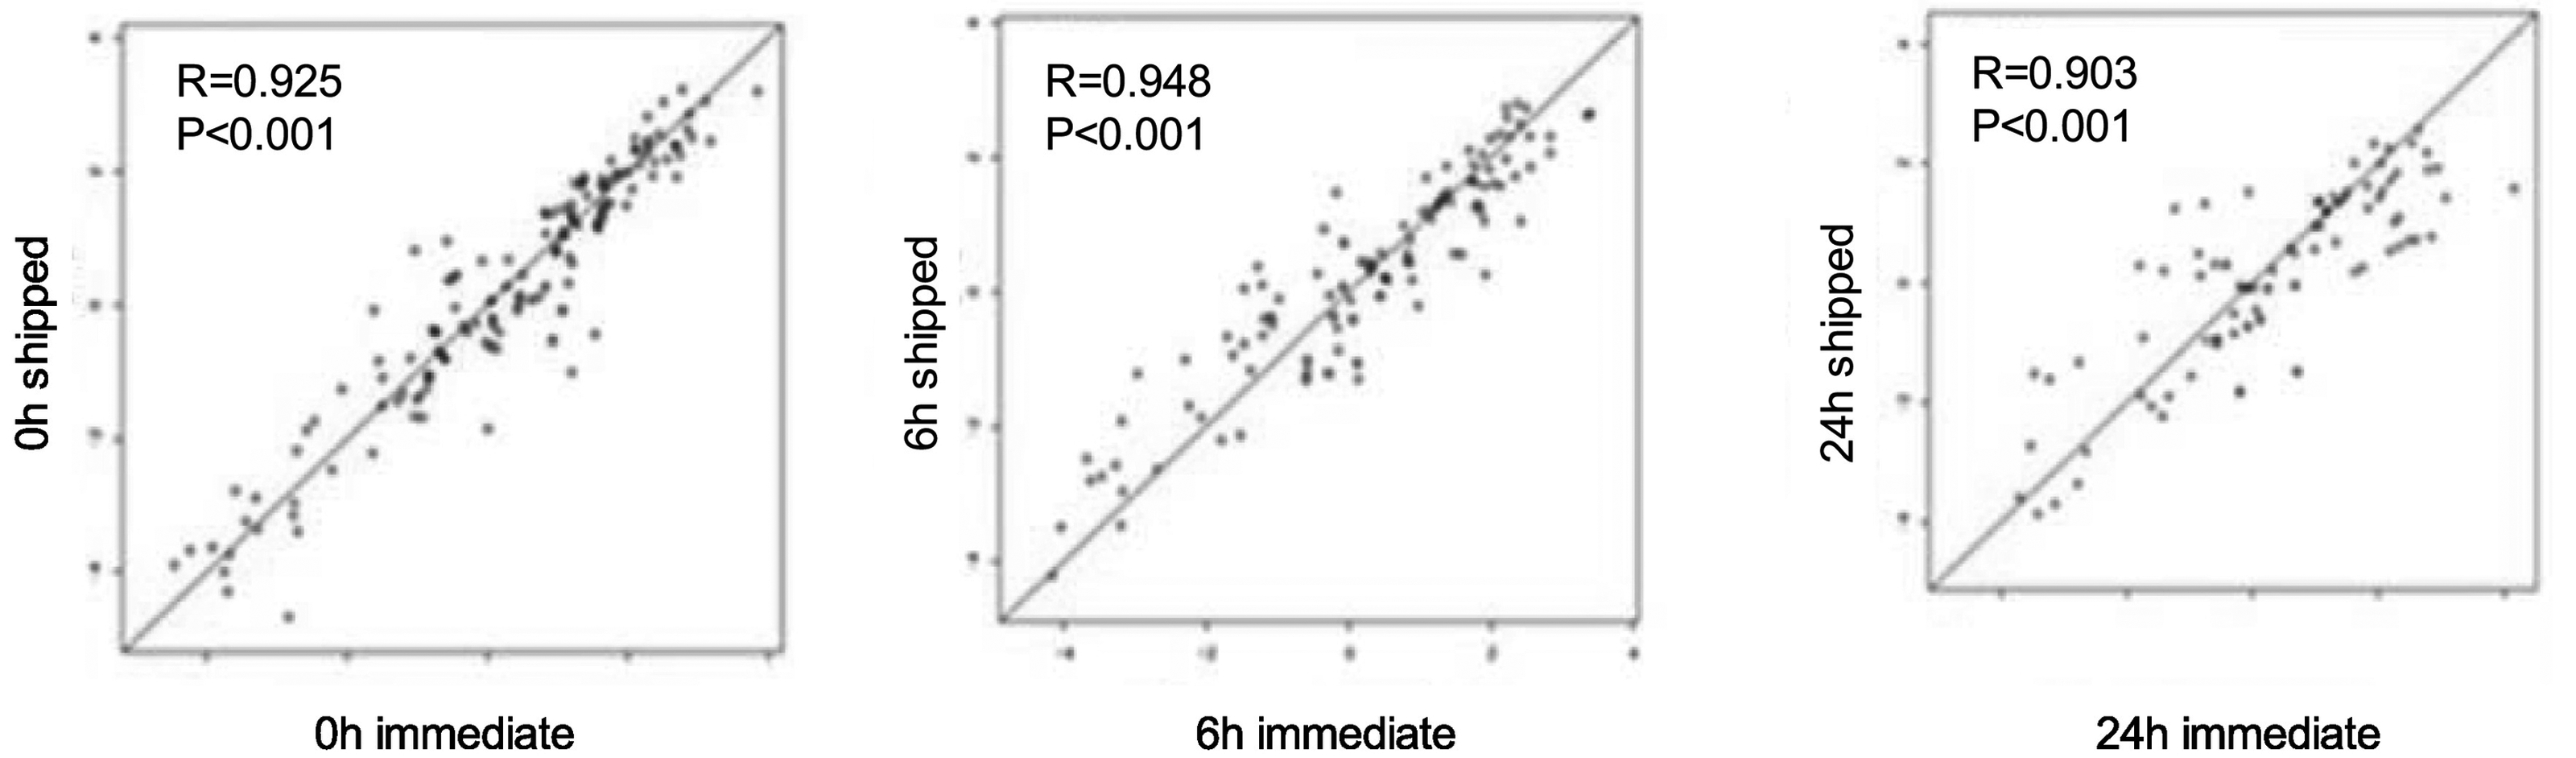
Protein concentration differences in CS tubes between those processed immediately (n=22) and those processed after 6h and 24h post-chemotherapy (n=20). Distribution of samples as a scatter plot of immediate process (x-axis) vs delayed processing after shipment. Samples were collected from patients before chemotherapy (left), 6h (middle) and 24h (right) after start of systemic chemotherapy.