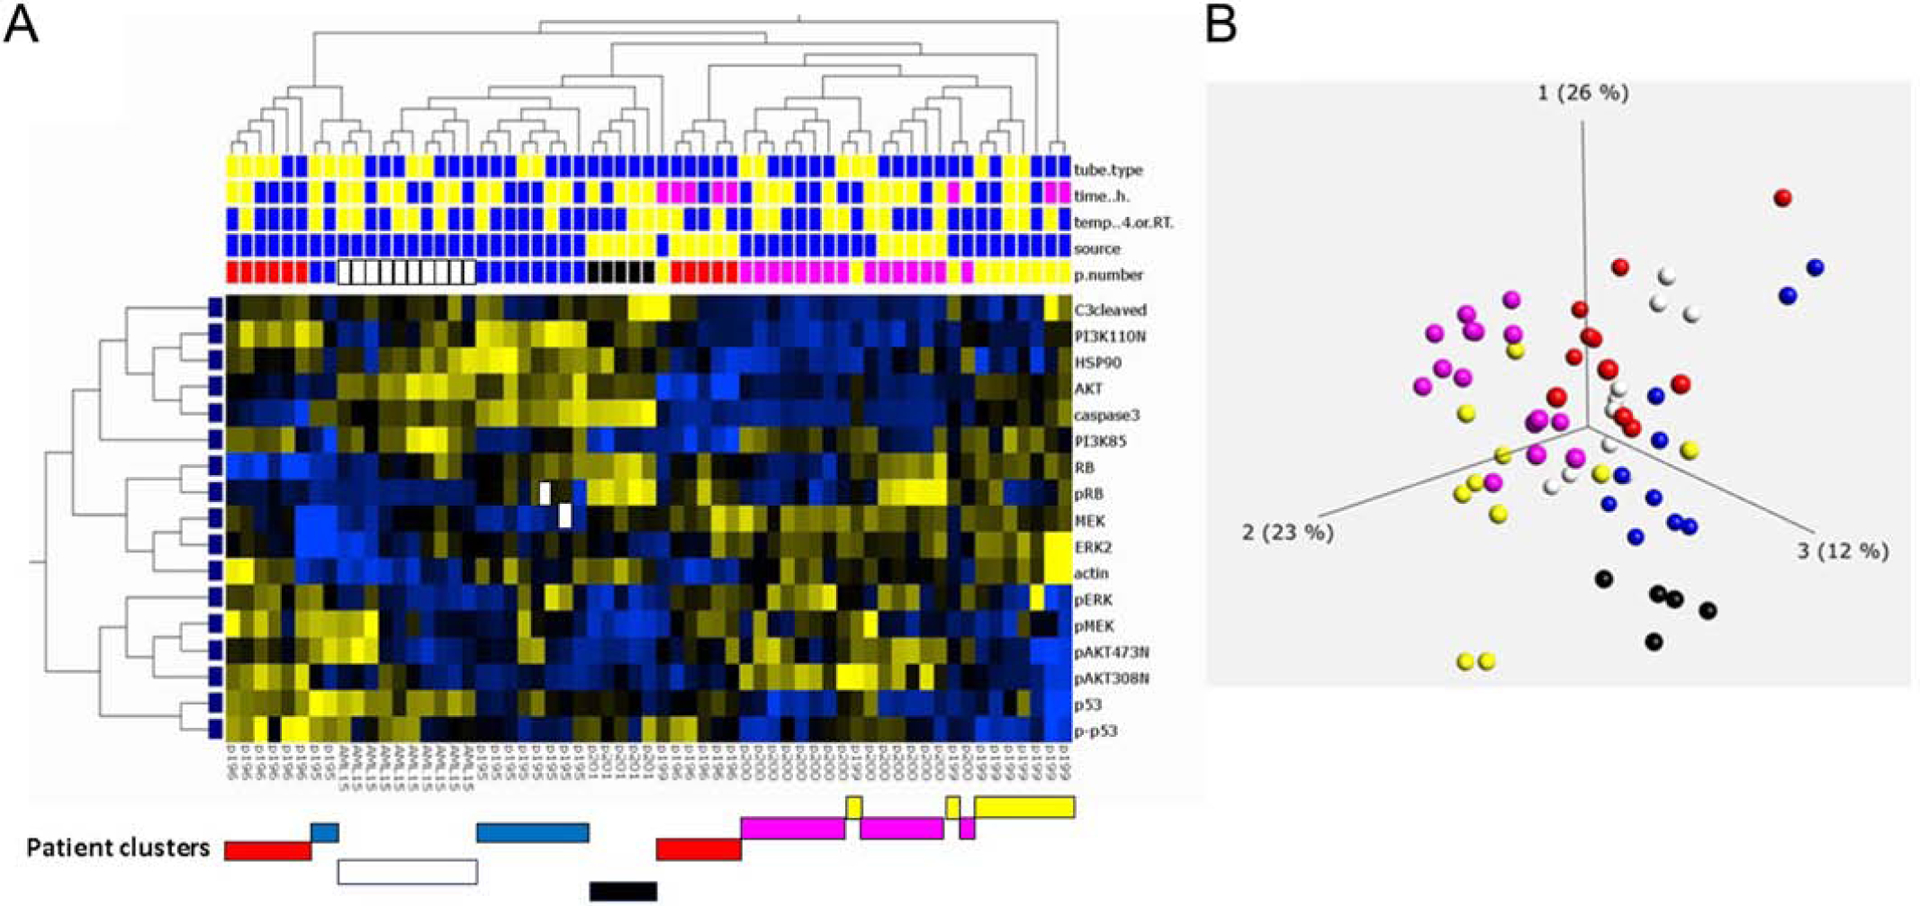
Figure 9:

Unbiased hierarchical clustering of protein expression to assess differences between leukemia patient samples. Seven AML patients were compared using hierarchical clustering. A. Protein expression (17 proteins) was compared between patient samples and comparisons were made by tube type (top row: heparin: blue, CS: yellow), transit time (second row: blue: 0–24h, yellow: 24–48h, pink: 49–72h+), temperature (third row: blue: 4°C, yellow: ambient temperature), and tissue source (fourth row: blue-peripheral blood, yellow: bone marrow. Clustering of patient samples noted below A. Patient sample details are provided in Figure 1 and Table S2. Clustering by Qlucore analysis with p = 0.05. B. PCA analysis of same AML patient samples. Each color represents samples collected from a single patient under multiple shipping conditions as outlined in Figure 1. Patient samples cluster despite differences in processing.
