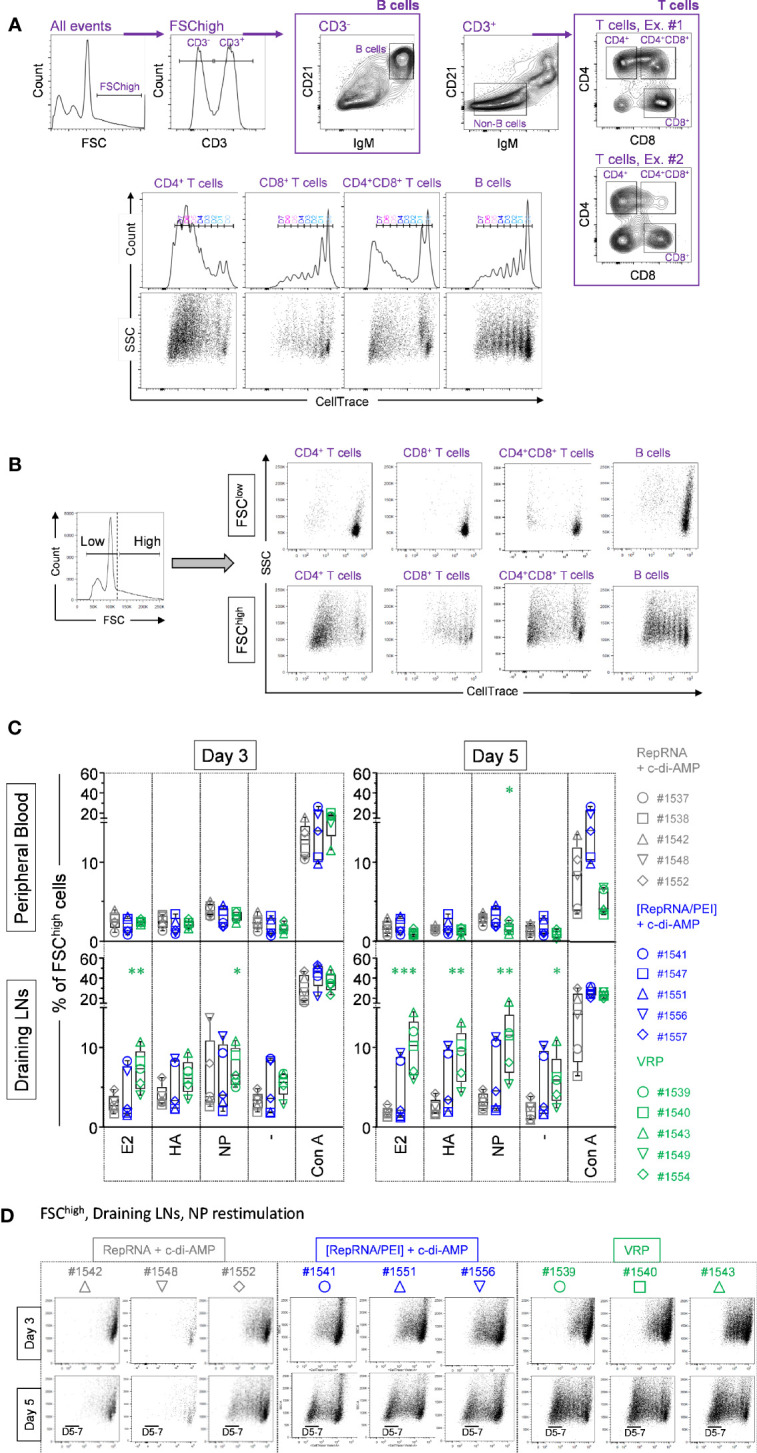
Figure 3.

Virus replicon particle (VRP) immunization induces specific immune cell proliferation in the draining lymph nodes. (A) The gating strategy used to quantify B and T cell proliferation, based on the expression of CD3, CD4, CD8, CD21, IgM, and CellTrace™ markers, is shown. (B) On the left side is shown a representative histogram, where FCSlow and FSChigh gates can be distinguished. Then, CD4+ T cells (CD3+CD21-IgM-CD4+CD8-), CD4+CD8+ T cells (CD3+CD21-IgM-CD4+CD8+), CD8+ T cells (CD3+CD21-IgM-CD4-CD8+), and B cells (CD3-CD21+IgM+CD4-CD8-) where analyzed in parallel from those two independent FSClow and FSChigh gates. The representative examples on the right side clearly show that proliferative cells are CellTracelow FSChigh. (C, D) At day 56 post-first immunization, freshly isolated PBMCs and LN cells where exposed against recombinant CSFV E2 and influenza virus HA and NP, or were let unstimulated (“-”). For all samples, Con A was used as a positive control. (C) Induction of FSChigh cell population following Ag restimulation. Cells from the individual animals are represented by separate symbols. The percentage of FSChigh cells was determined by flow cytometry with FlowJo. (*p ≤ 0.05; **p ≤ 0.01; ***p ≤ 0.001). (D) After 3 or 5 days of cell culture, the numbers of division cycles using CellTrace™ of proliferating cells from FSChigh subset from restimulated LN cells were determined by flow cytometry with FlowJo. Representative animals are shown for the three animal groups “RepRNA + c-di-AMP”, “[RepRNA/PEI] + c-di-AMP” and “VRP”.
