
Figure 7.
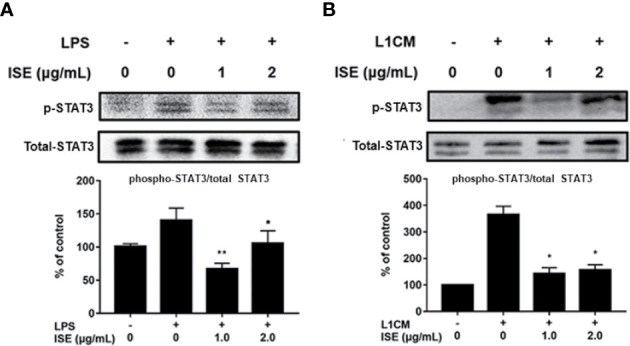
Effects of ISE on STAT3 signal. RAW264.7 macrophages were pretreated with different concentrations of ISE for 1h and then stimulated by 1.0μg/mL LPS or 3T3-L1CM for 30min. Total cell lysates were extracted, and then western blotting using specific antibodies was used to determine the expression of p-STAT3 and STAT3 in LPS (A) and 3T3-L1CM (L1CM) stimulation (B), respectively. The value of a control was set at 100%, and the relative value was presented as fold induction to that of the control, which was normalized to total STAT3. Statistical comparisons were made with each vehicle controls. The values are means ± SD, n = 3. *P < 0.05, **P < 0.01.