FIGURE 2.

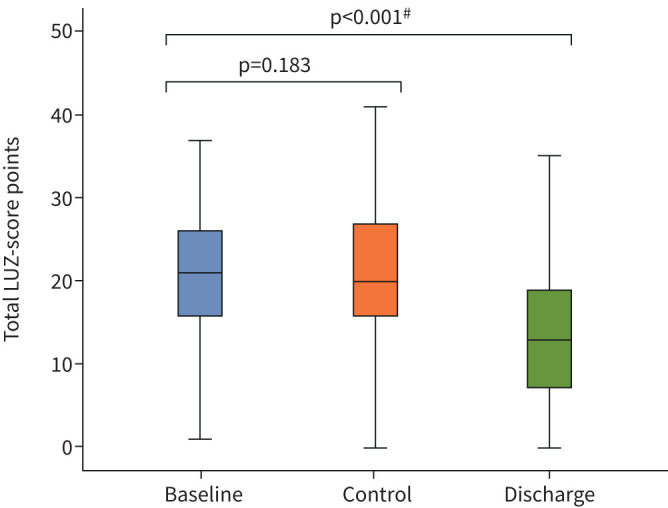
Box plots showing lung ultrasound Zaragoza (LUZ)-score distribution at baseline, control and discharge. #: Mann–Whitney U-test between LUZ-score at baseline and LUZ-score at baseline and discharge.

Box plots showing lung ultrasound Zaragoza (LUZ)-score distribution at baseline, control and discharge. #: Mann–Whitney U-test between LUZ-score at baseline and LUZ-score at baseline and discharge.