FIGURE 4.

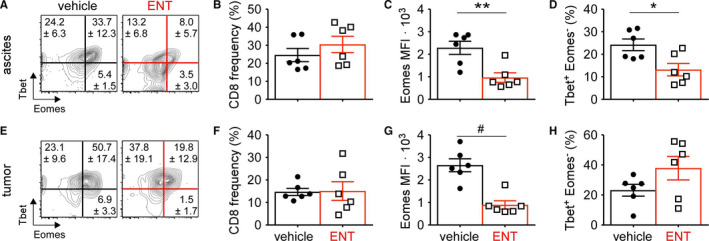
CD8 T cell quality is improved following class I HDAC inhibition. ID8 tumor‐bearing mice were treated daily with vehicle or ENT starting on day 21 and omental tumors and ascites harvested on day 31. Intracellular staining and flow cytometry was used to assess transcription factor expression levels in CD8 T cells. A, Representative flow plots of Tbet vs Eomes expression in CD8 T cells from ascites fluid, gated on live/dead, CD3+, CD8+ cells. Numbers indicate mean ± SD. B, Frequency of CD8 T cells in ascites. C, Per CD8 T cell expression of Eomes measured by MFI in ascites. D, Frequency of Tbet + Eomes‐ CD8 T cells in ascites fluid. E, Representative flow plots of Tbet vs Eomes expression in CD8 T cells from omental tumors, gated on live/dead, CD3+, CD8+ cells. F, Frequency of CD8 T cells in tumors. Numbers indicate mean ± SD. G, Per CD8 T cell expression of Eomes measured by MFI in tumors. H, Frequency of Tbet + Eomes‐ CD8 T cells in the tumor mass. Mean and standard error of the mean are shown. *P < .05. **P < .005. # P < .0005
