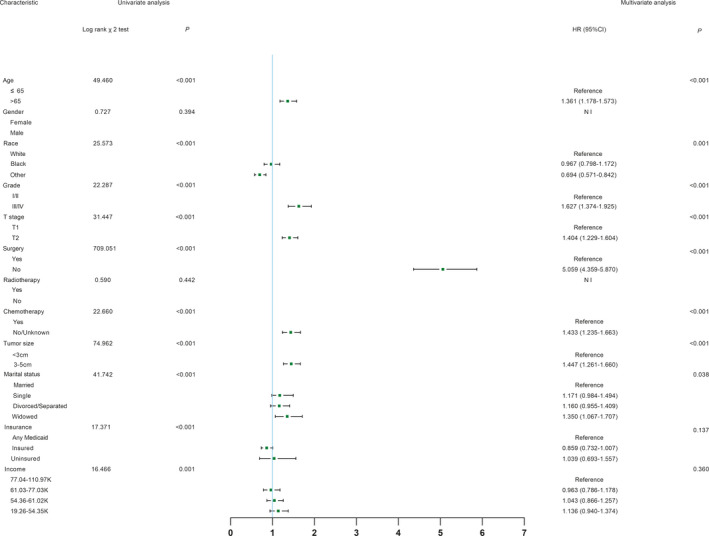
FIGURE 2.

Univariate analysis and forest plot of the hazard ratio of hepatocellular carcinoma cancer‐specific survival based on the training cohort. HR, hazard ratio; CI, confidence interval

Univariate analysis and forest plot of the hazard ratio of hepatocellular carcinoma cancer‐specific survival based on the training cohort. HR, hazard ratio; CI, confidence interval