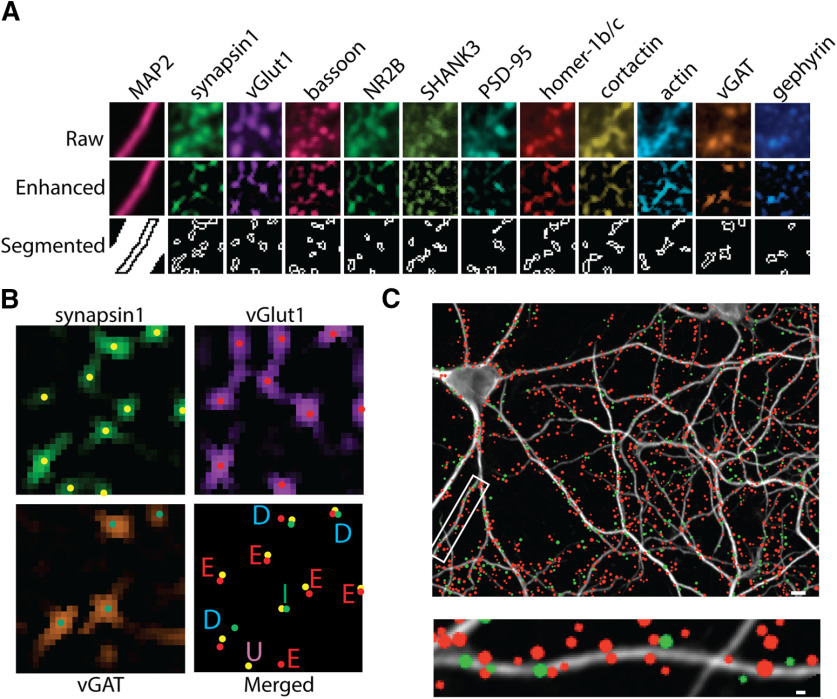
Figure 1.
Measuring synaptic content from excitatory and inhibitory synapses using CellProfiler. A, Multiplexed images of PRISM stained DIV21 hippocampal neurons are used as input for the CellProfiler pipeline. Raw images (top) are aligned using MAP2 signal. A white-top filter is applied to enhance puncta (middle). Puncta are thresholded and separated into individual puncta using peak intensity (bottom). B, Synapses are labeled excitatory (E) or inhibitory (I) using the presence or absence of excitatory-specific (vGlut1) or inhibitory-specific (vGAT) markers. Synapses with both markers are labeled as dual (D). Clusters that do not contain either marker are labeled as unknown (U). C, Representative image (top) and enlarged dendrite (bottom) from a MAP2-stained DIV21 hippocampal neuron with excitatory (red) and inhibitory (green) synapses labeled as colored circles. The size of the colored circle represents the relative synapsin1 area. Scale bar: 1 μm.

