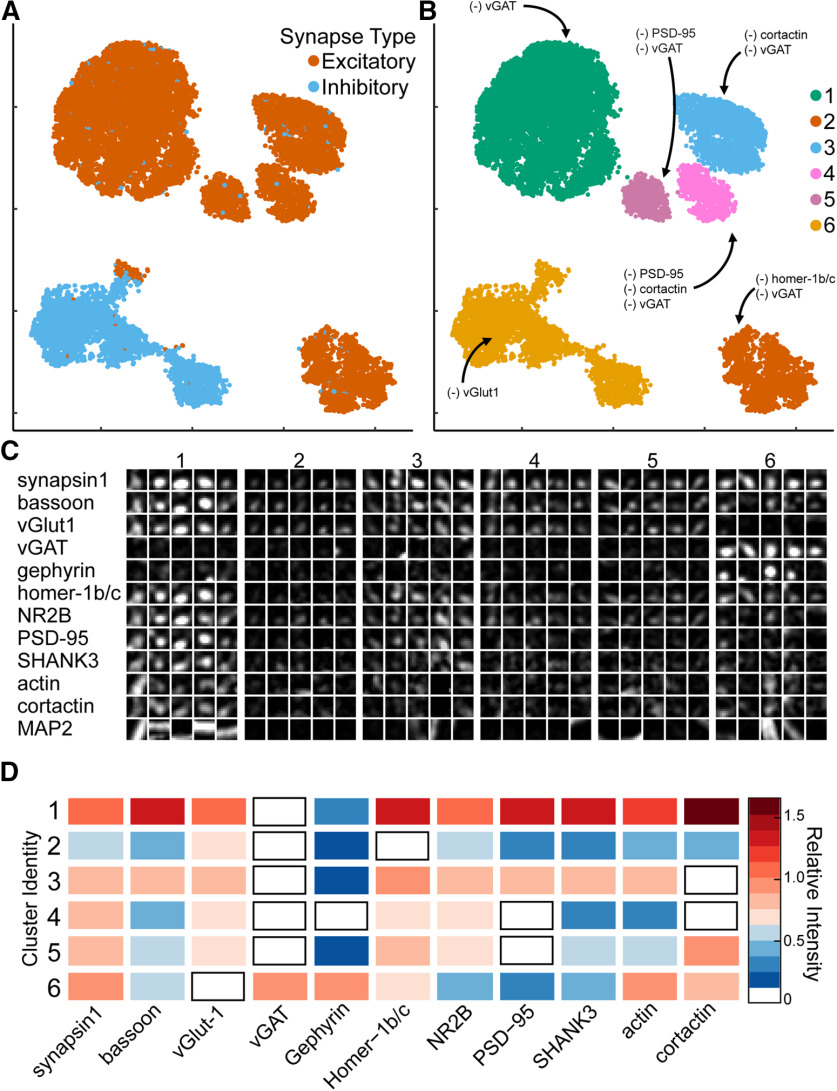
Figure 2.
Synaptic cluster identification using UMAP. A, UMAP plots of individual synapses (n = 10,000) using CellProfiler output separates excitatory (red) and inhibitory (blue) synapses into two major clusters with multiple subclusters. B, Unique clusters identified by HDBSCAN. (–) indicates synaptic target below limit of detection. C, Representative synapses from each cluster. D, Heatmap indicates the average relative intensities for each synaptic target within each cluster. All values are normalized to untreated mean integrated intensity.

