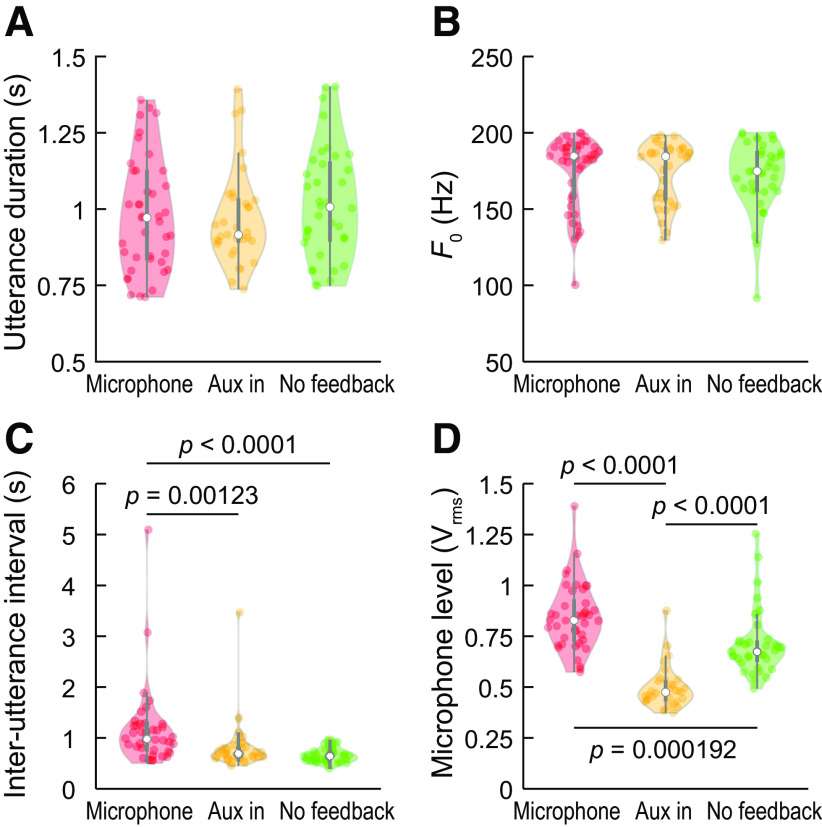
Figure 1.
Comparison of voice measures for the three vocal production conditions. A, Utterance duration did not differ across feedback conditions. B, Voice F0 was slightly lower and more variable when subject vocalized without auditory feedback. C, Intervals between successive self-paced utterances were longer during the microphone feedback condition compared with the no auditory feedback condition. D, Sound level as captured by the recording microphone (Vrms) varied as a function of feedback condition and was greatest when during the microphone condition, and least when the Aux In port was used to present auditory feedback during vocalization. In each violin plot, colored circles represent individual trials, white circle denotes the median, thick gray bar denotes Q1 and Q3, and whiskers show the range of lower and higher adjacent values (i.e., values within 1.5 interquartile ranges below Q1 or above Q3, respectively); p values indicate results of Wilcoxon rank-sum tests, FDR corrected for multiple comparisons.

