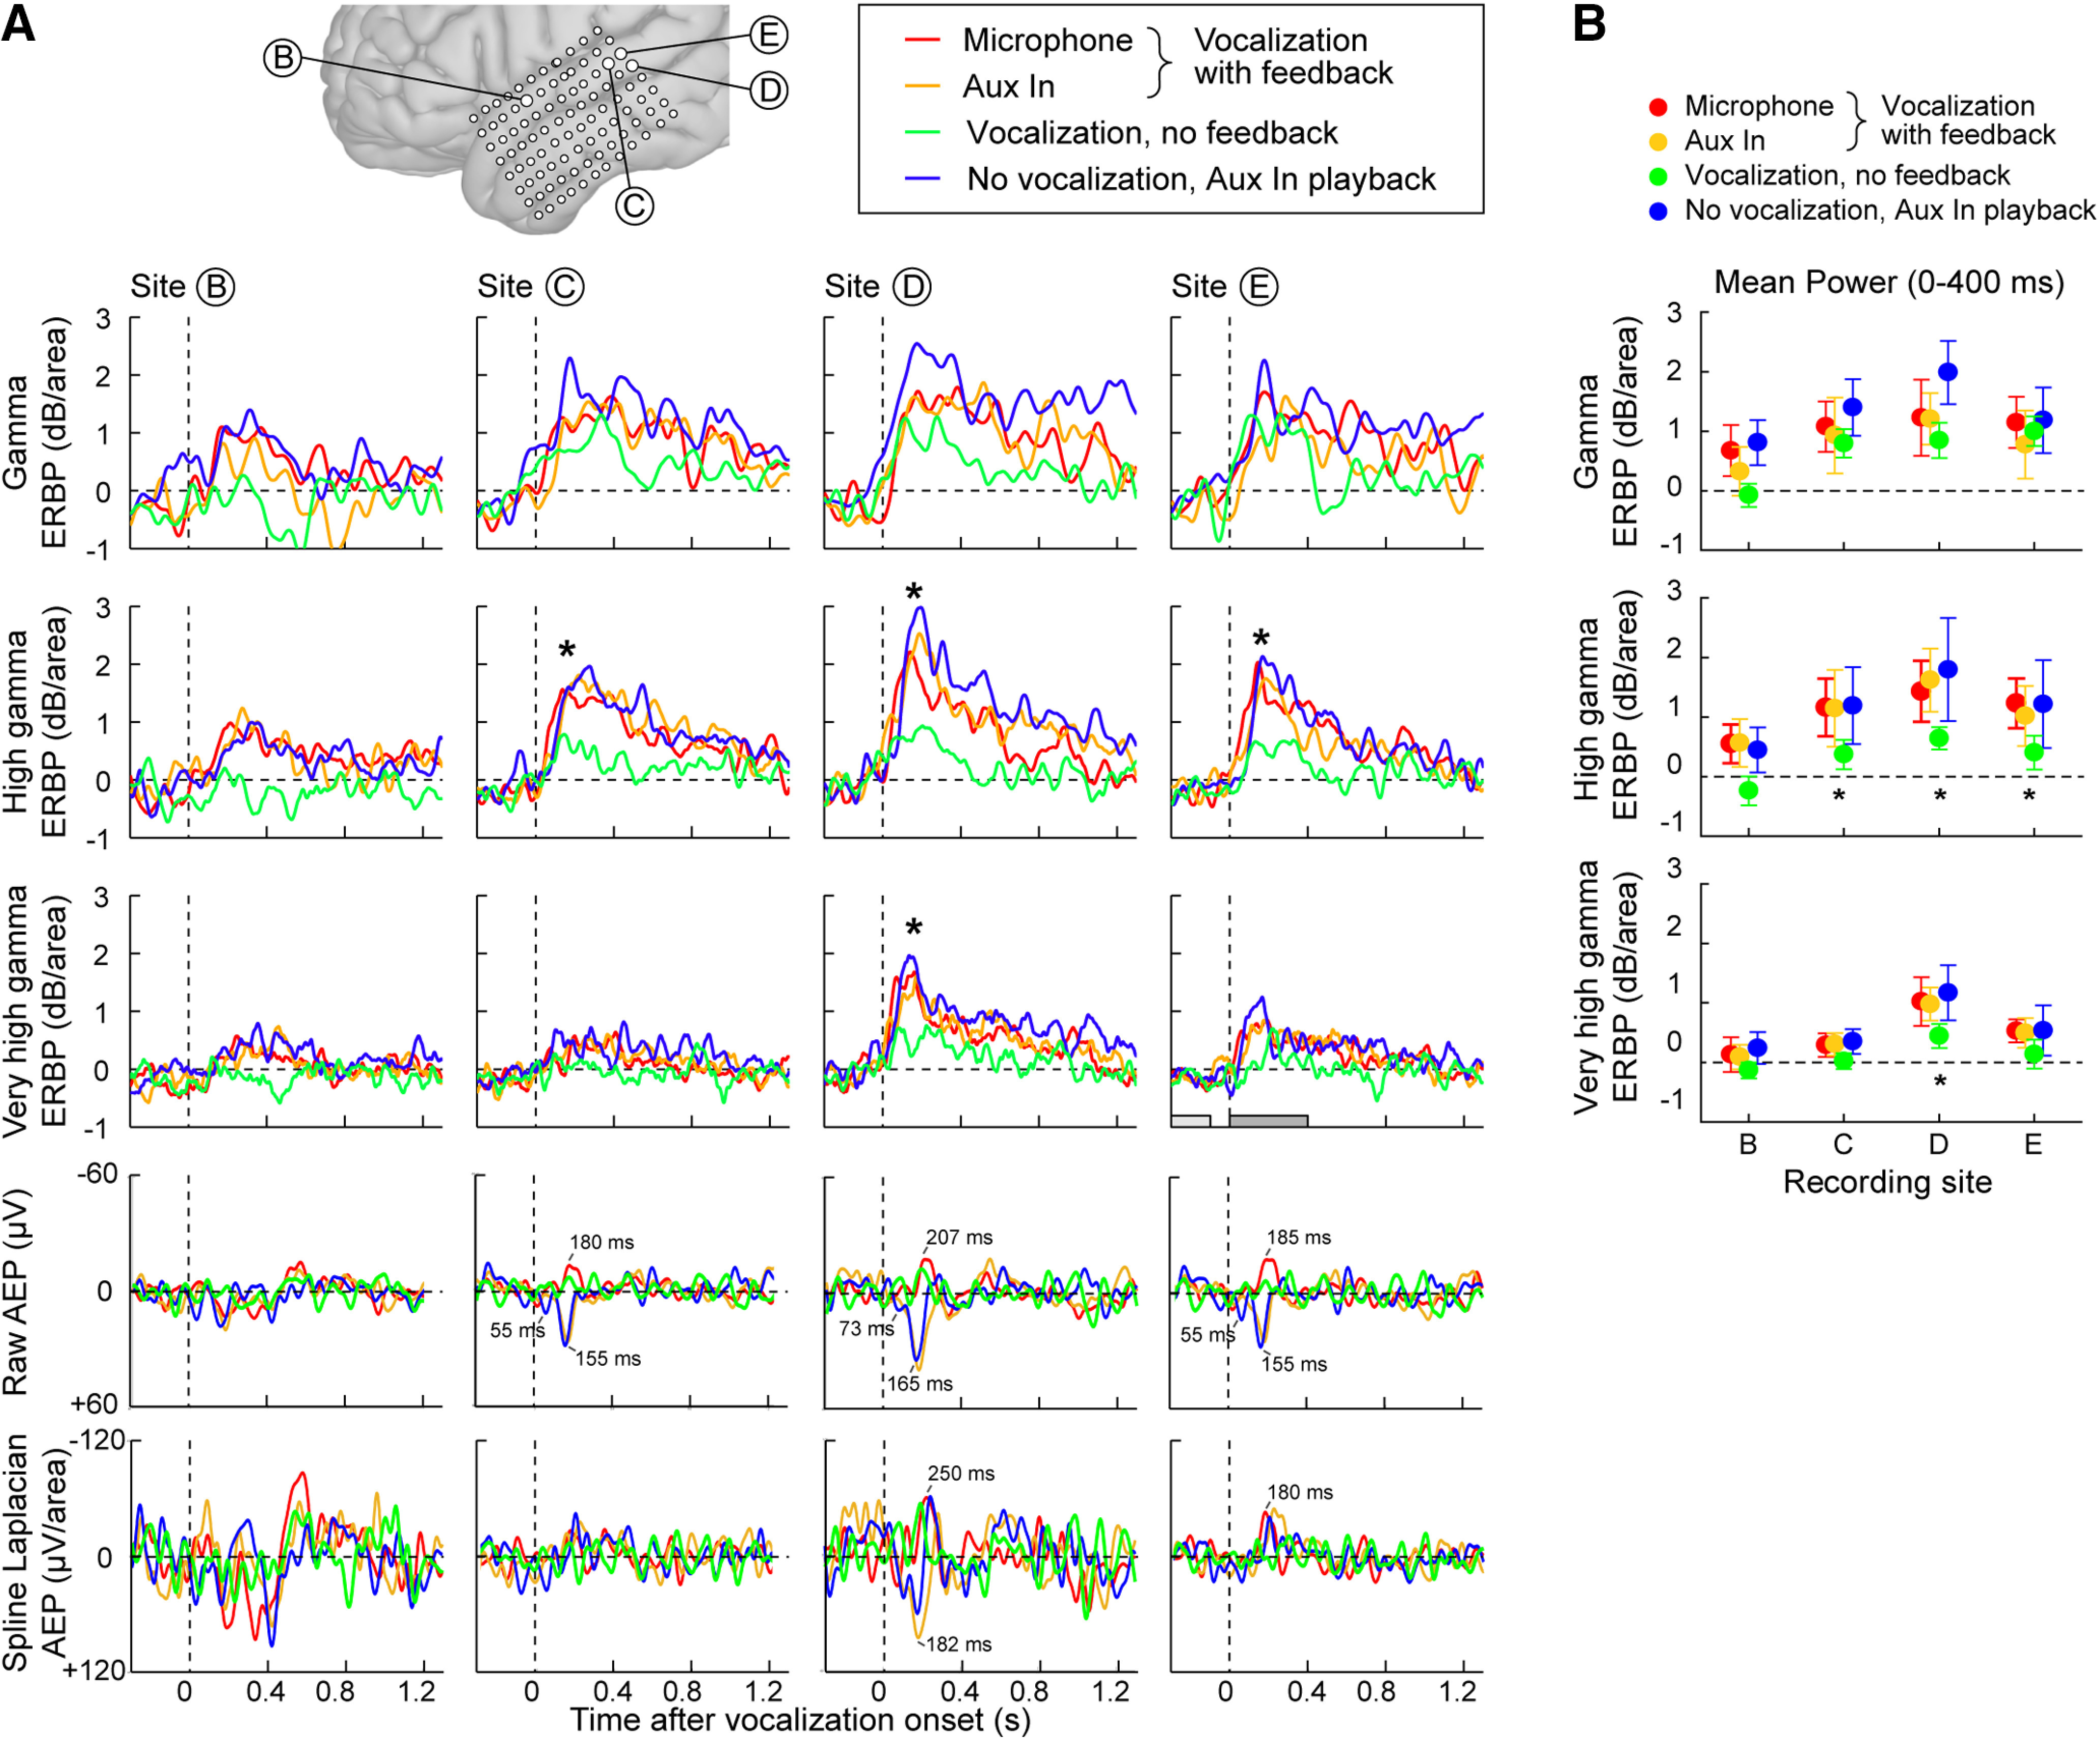
Figure 5.

A, Band-specific spline-Laplacian-transformed mean ERBP [γ (top row), high γ (second row), and very high γ (third row)] for responsive STG sites B–E (columns) in each experimental condition. Time windows used to statistically compare mean power before and after voice onset are shown as light and dark gray bars, respectively (see site E in third row). Raw AEPs (fourth row) and spline-Laplacian-transformed AEPs (bottom row) are shown for each and each condition. Peak latencies of prominent peaks are noted in ms. B, Plots of mean band-specific power for each recording site and condition. Significant differences in the poststimulus window between mean power of the vocalization with no feedback condition (green plots) and the three other conditions were observed and are indicated by asterisks (ANOVA, p < 0.05).
