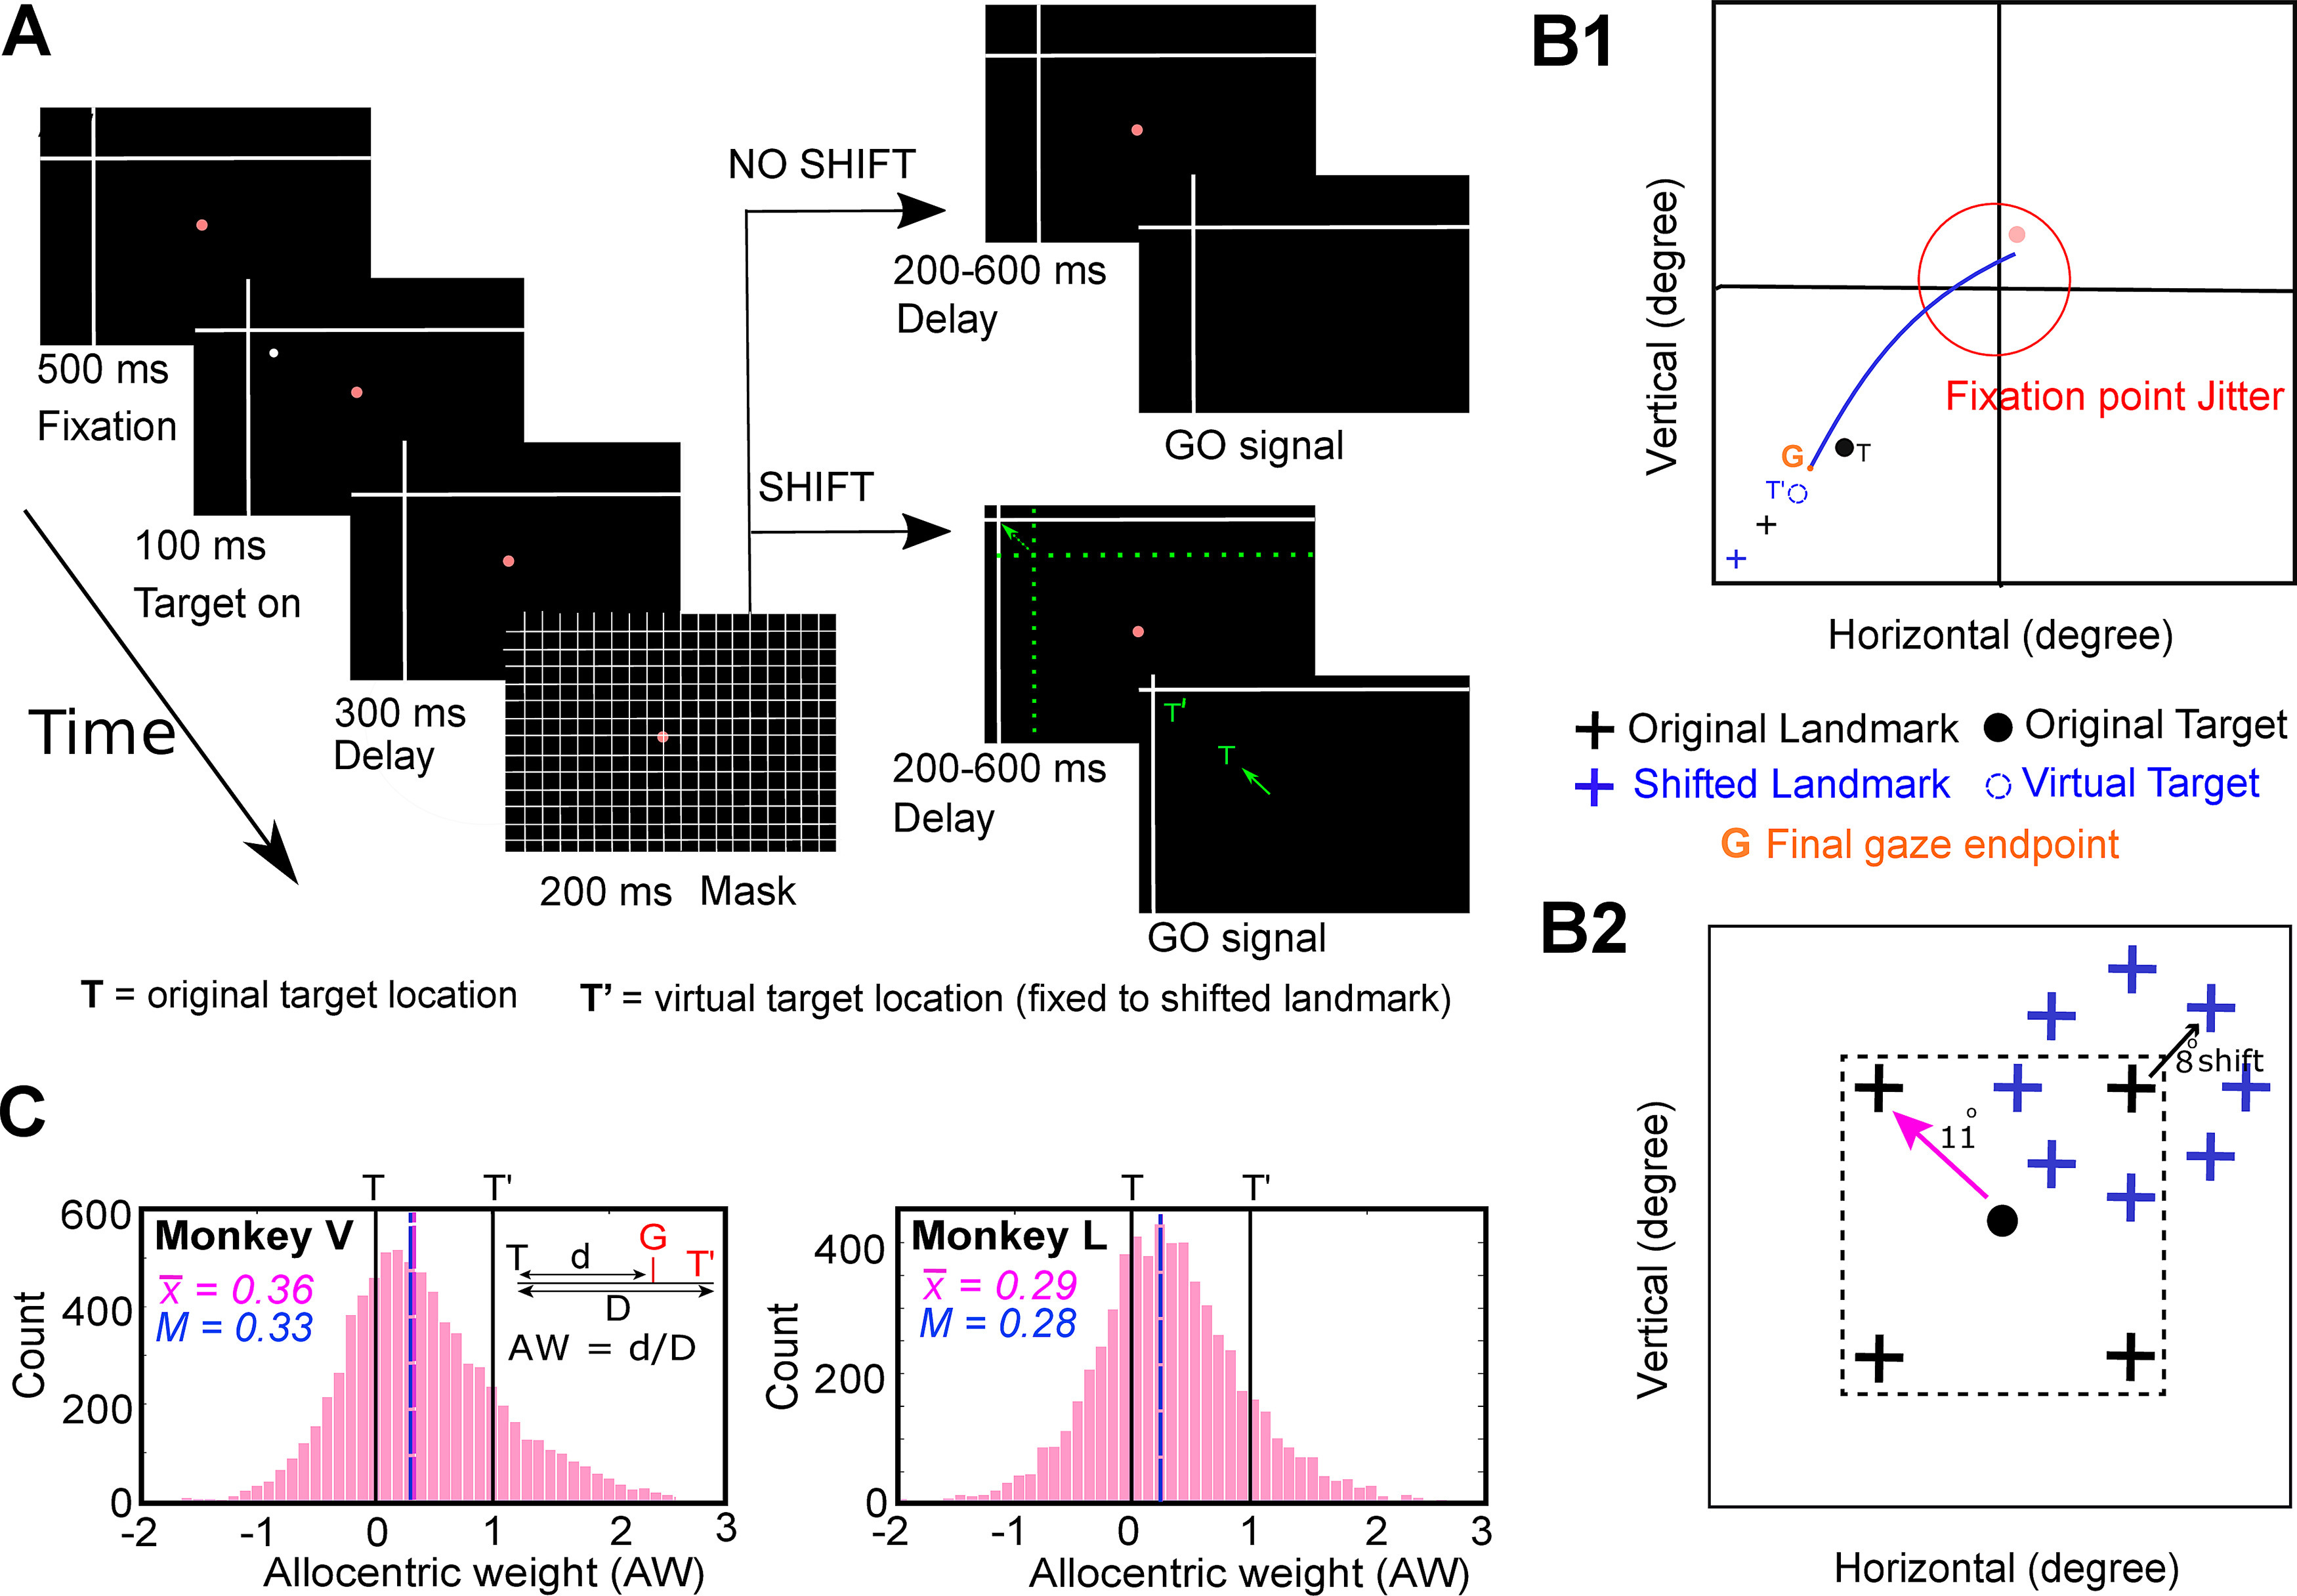
Figure 1.

Experimental paradigm and behavior. A, Cue-conflict paradigm and its timeline. The monkey began the trial by fixating for 500 ms on a red dot in the presence of a landmark (L, intersecting lines) was already present on the screen. Then a target (white dot) was presented for 100 ms, followed by a 300-ms delay and a grid-like mask (200 ms). After the mask, and a second memory delay (200–600 ms), the animal was signaled (extinguishing of the fixation dot, i.e., go signal) to saccade head-unrestrained to the remembered target location either when the landmark was shifted (L’, denoted by the broken green arrow) or when it was not shifted (i.e., present at the original location). The monkey was rewarded for landing the gaze (G) within a radius of 8–12° around the original target (monkeys were rewarded for looking at T = original target, at T’ = virtually shifted target fixed to landmark, or between T and T’). The green arrow represents the head-unrestrained gaze shift to the remembered location. The reward window was centered on T so that the behavior was not biased. Note that the actual landmark shift was 8°, but for clarity, it has been increased in this schematic figure as indicated by the broken green arrow. Notably, the green colored items are only for the purposes of representaion (they were not present on the screen). B1, Schematic of a gaze shift (blue line) from the home fixation point (red dot) toward the virtual target (broken blue circle, T’) fixed to the shifted landmark (blue cross, L’). G refers to the final gaze endpoint. B2, Schematic illustration of all (four) possible locations of the landmark (black cross) for an example target (black dot, T), with all possible locations of the shifted landmark relative to original landmark location. The landmark was presented 11° (indicated by pink arrow) from the target, in one of the four oblique directions and postmask it shifted 8° (blue cross stands for the shifted landmark, black arrow depicts the shift) from its initial location in one of the eight radial directions around the original landmark. C, AW distribution (x-axis) for Monkey V (left) and Monkey L (right) plotted as a function of the number of trials (y-axis) for all the analyzed trials from the spatially tuned neurons. The mean AW (vertical pink line) for MV and ML was 0.36 and 0.29 (mean = 0.33), respectively. Note: the “shift” condition included 90% of trials and the “no shift” condition only included 10% of the trials. The AW was calculated for the shifted condition only. The no-shift condition allowed to test for all the range of shifts. To not bias the behavior, the reward window included scores from –1 to +1.
