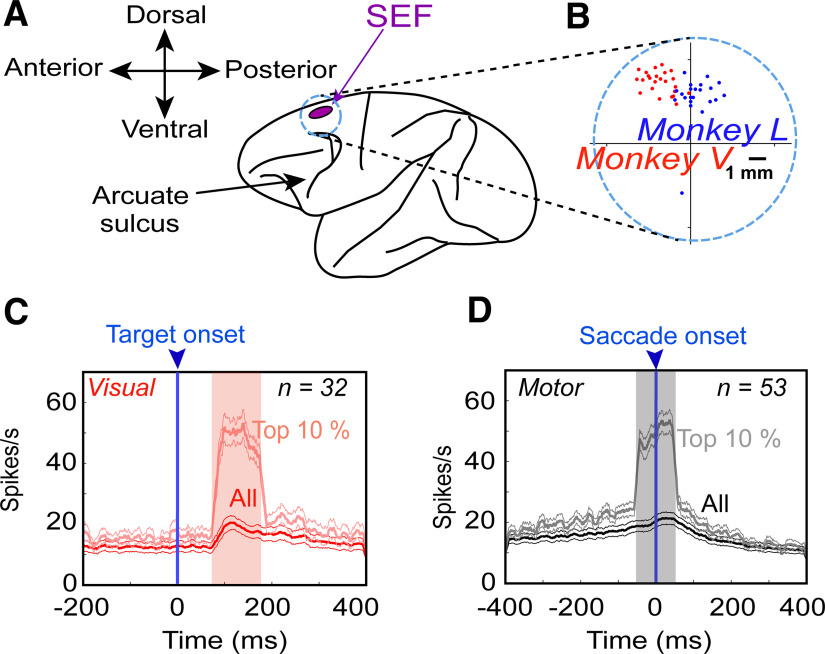
Figure 2.
SEF recordings A, Purple inset represents the location of the SEF and the circle (note that it does not correspond to the original size of chamber) corresponds to the chamber. B, A zoomed-in overlapped section of the chamber and the sites of neural recordings (dots) confirmed with 50-μA current stimulation from Monkey V (red) and Monkey L (blue). C, Mean (±95% confidence) of the spike-density plots [dark red: all trials from all neurons; light red: top 10% best trials most likely representing the hot spot of every neuron’s response field in the visual population, aligned to the onset of the target (blue arrow)]. D, Same as C but for motor responses aligned to the saccade onset (blue arrow). The shaded region denotes the 100-ms sampling window. Note that, in both plots, the “top 10%” neural data were selected using the above sampling windows; therefore, delay activity is not completely represented in these plots (it will be examined later in Results).

