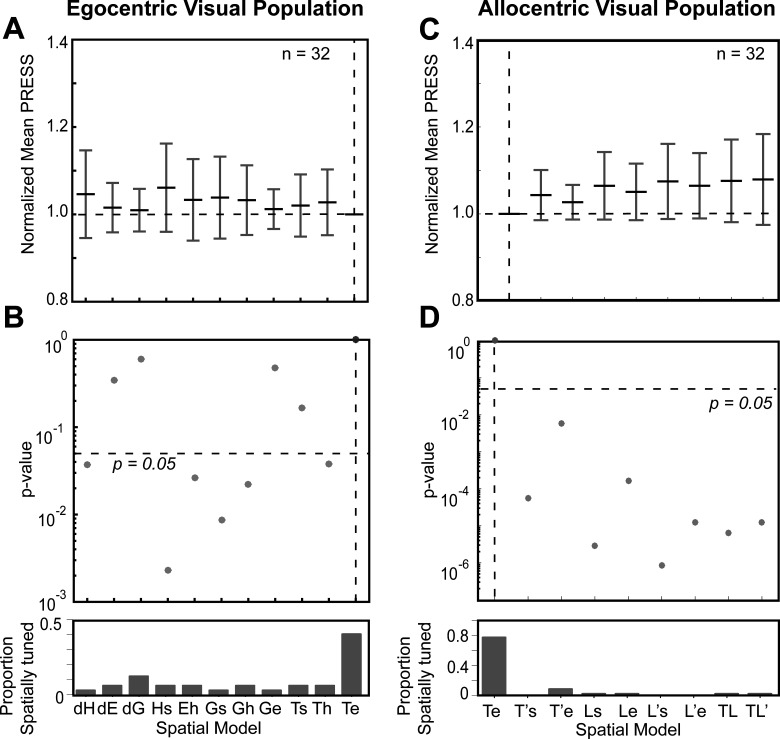
Figure 6.
Egocentric and allocentric population fit residuals and statistics for all visual neurons. A, The mean PRESS (±SEM) residuals of all visually responsive neurons (n = 32), i.e., data relative to fits computed to all tested egocentric models. These values were normalized by dividing by the mean PRESS residuals of the best spatial model, in this case Te. B, p value statistics performed on the residuals shown above (Brown–Forsythe test). Te (broken vertical black line) is the best fit; however, dE, dG, Ge, and Ts were also retained. C, Same as A but for best-fit egocentric model comparison with all allocentric models. D, Same as B, Te is still the best fit.

