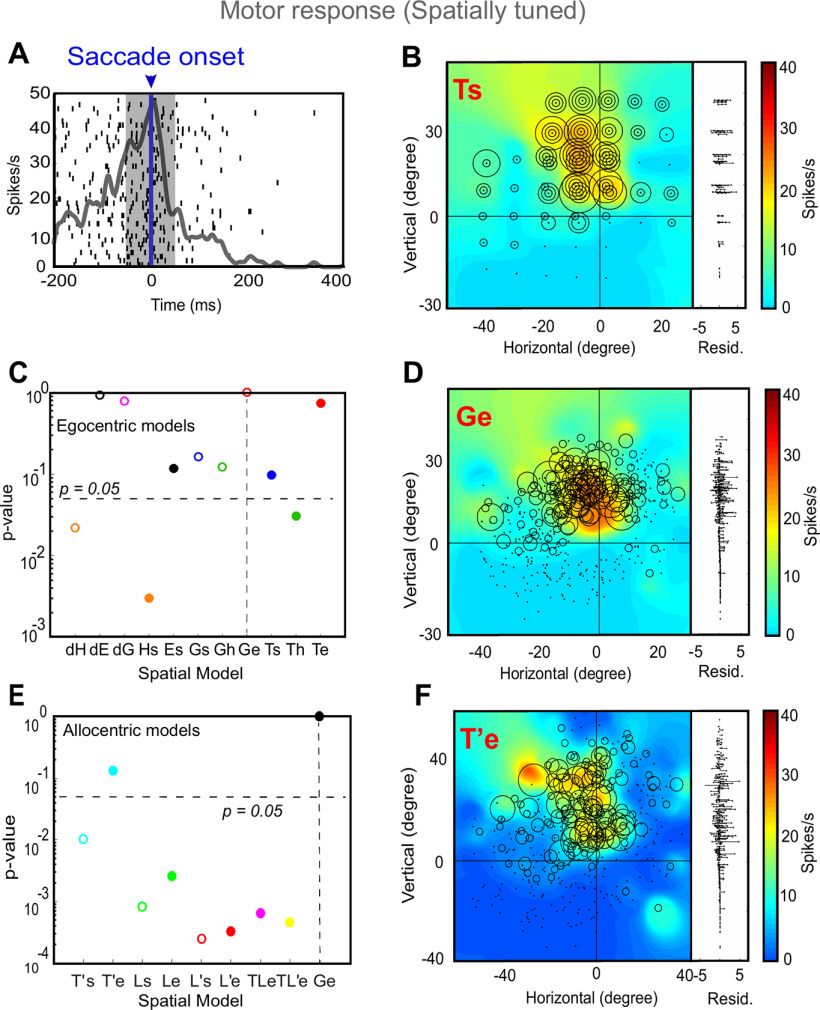
Figure 7.
An example of response field analysis of a motor response. A, Raster/spike density plot (with top 10% responses) of the motor neuron aligned to the saccade onset (blue arrow); the shaded gray area corresponds to the sampling window (–50 to 50 ms) for response field analysis. B, Representation of neural activity for Ts: target in space (screen). The corresponding residuals are displayed to the right. C, The p values statistics and comparison between Ge (p = 10° = 1; the best-fit spatial model that yielded lowest residuals) and other tested models (Brown–Forsythe test). D, Representation of the neural activity in Ge (future gaze relative to eye), the best coordinate. E, The p value statistics and the comparison of the best egocentric model, Ge, with other allocentric spatial models. Ge is still the best-fit model, with T’e (shifted target in eye coordinates) as the second best model implying the influence of the shifted landmark on the motor response. F, Representation of the neural activity in T’e, i.e., shifted target relative eye. 0, 0 represents the center of the coordinate system that led to the lowest residuals (best fit).

