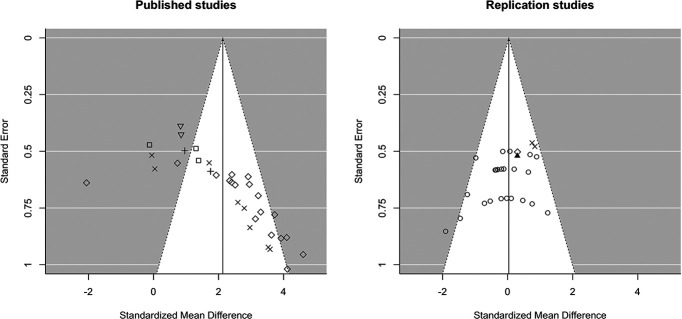
Figure 1.
Funnel plots including published studies (left panel) and our own replication studies (right panel) in which MDZ was used as amnestic agent. Each point represents an observed effect size Hedges’ g against its SE. Visual inspection of the plot on the right panel shows that our replication studies are symmetrically scattered around the effect estimate of 0.04, indicating that the estimated effect size is close to zero and suggesting that no trend in one particular direction was observed across studies. In contrast, the plot of published studies (left panel) clearly shows asymmetry, and the reported effect sizes seem to depend strongly on the research group in which the studies were performed (represented by the different symbols in the left plot). Egger’s test confirmed plot asymmetry (p < 0.0001), even when considering the moderating influence of research group. One should be careful to attach value to the estimated effect size shown in the left funnel plot, given the evidence for publication bias and because the nesting of studies within research groups is not accounted for. The funnel plots were based on the meta-analytic models without moderators. Symbols represent the research group in which each study was performed (left panel) or the lab space that was used (right panel). Note that three of our exact replication studies (right panel) were performed in the same lab space as some of the original, published studies (left panel).

