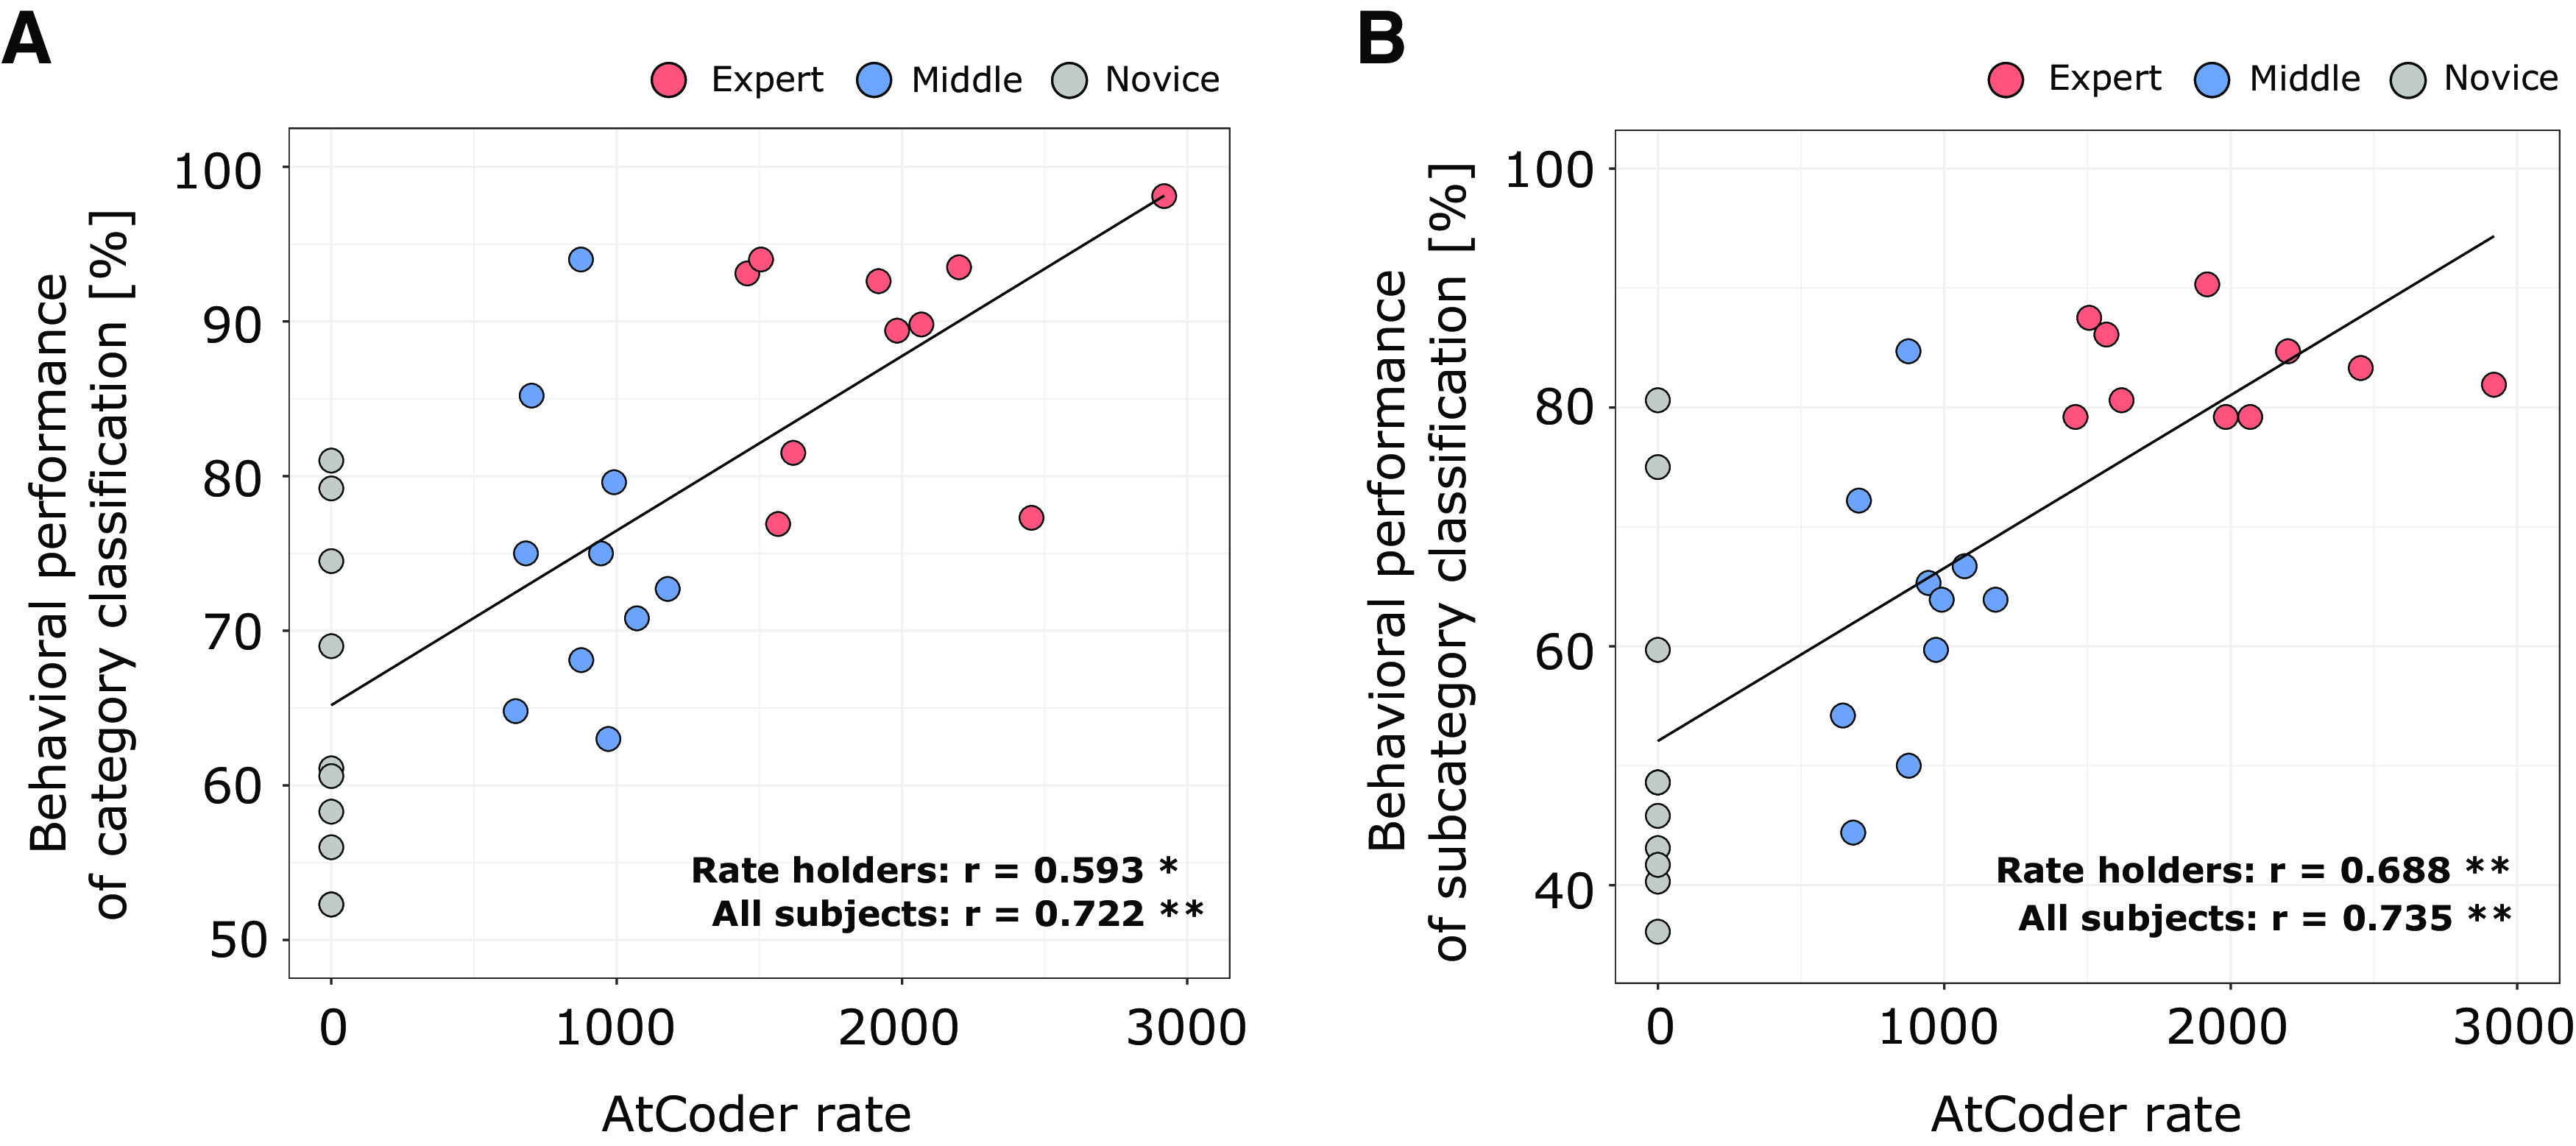
Figure 2.

Correlations between behavioral performance and programming expertise indicator. A, Scatter plot of behavioral performances of category classifications against the values of adopted expertise reference (i.e., AtCoder rate). B, Scatter plot of behavioral performances of subcategory classifications against the values of the same expertise reference. Each dot represents an individual subject. Significance of the correlation coefficients (r) was denoted as *p < 0.05 and **p < 0.005. The solid lines indicate a fitted regression line estimated from all subject data.
