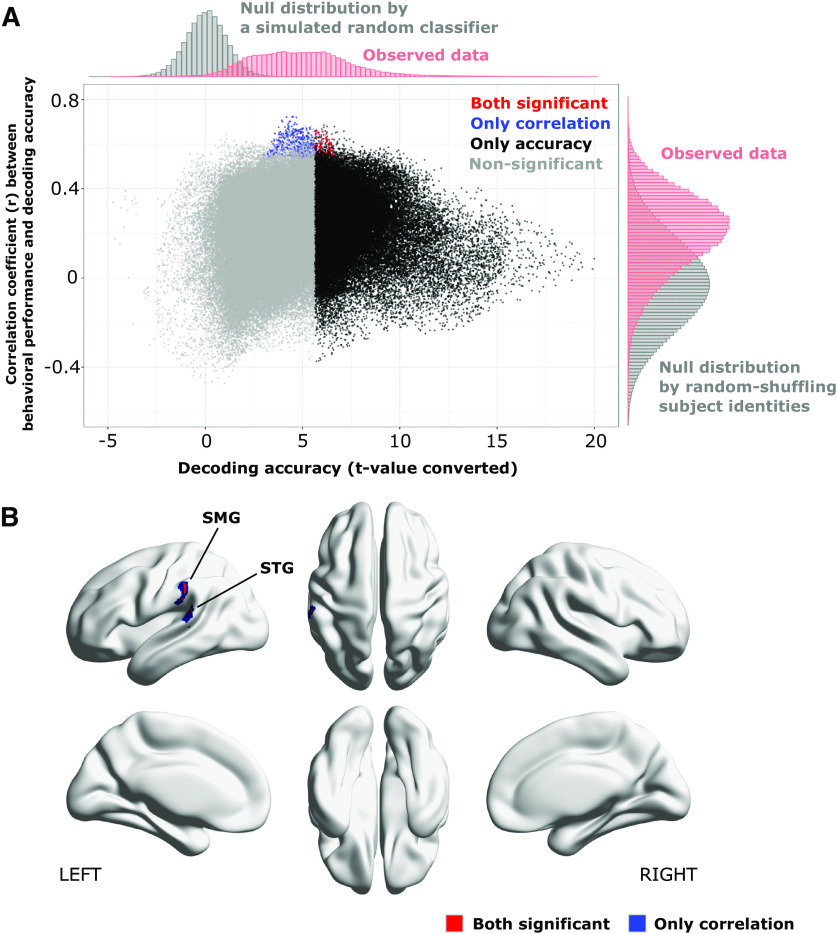
Figure 8.
Identifying searchlight centers that showed both significant subcategory decoding accuracy and significant correlation to individual behavioral performances. A, Scatter plot of searchlight results; x-axis shows t values calculated from all subjects’ decoding accuracies on each searchlight locations; y-axis indicates correlation coefficients between subcategory decoding accuracies and behavioral performances. Red-colored dots denote the searchlights showing both significant decoding accuracy and correlation, while blue and black denote those only showed significant decoding accuracy or correlations. Non-significant searchlights were colored in gray. The observed distributions of subcategory decoding accuracies and correlations are respectively shown on top-side and right-side of the figure accompanied with null distributions calculated by randomized simulations. B, Locations of searchlight centers that showed both significant subcategory decoding accuracy and significant correlations to individual behavioral performances.

