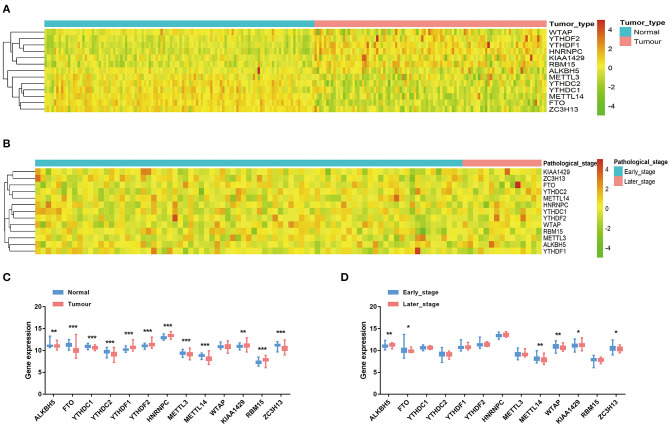
Figure 1.
The expression of the 13 m6A RNA methylation regulators in TNBC. (A) The heatmap of gene expression in TNBC tissues (n = 98) and normal tissues (n = 114). (B) The heatmap of gene expression in TNBC patients with different pathological stages. (C) The boxplot of gene expression levels in TNBC tissues and normal tissues. Horizontal line: mean with 95% confidence interval (CI). (D) The boxplot of gene expression levels in early-stage (stage I and stage II) TNBC patients and late-stage (stage III and stage IV) TNBC patients. Horizontal line: mean with 95% CI. *P < 0.05, **P < 0.01, ***P < 0.001.

