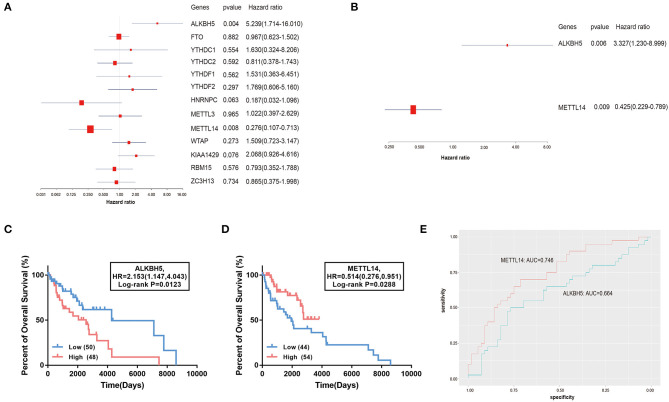
Figure 2.
Association of the 13 m6A RNA methylation regulators with the overall survival of TNBC patients. (A,B) The forest plot of univariate and multivariate Cox regression analysis. (C,D) The comparison of survival curves between high- and low- ALKBH5 and METTL14 expression subgroups. HR, hazard ratio. (E) The ROC curves of the two genes suggesting the sensitivity and specificity for survival prediction. ROC, receiver operating characteristic; AUC, area under the curve.

