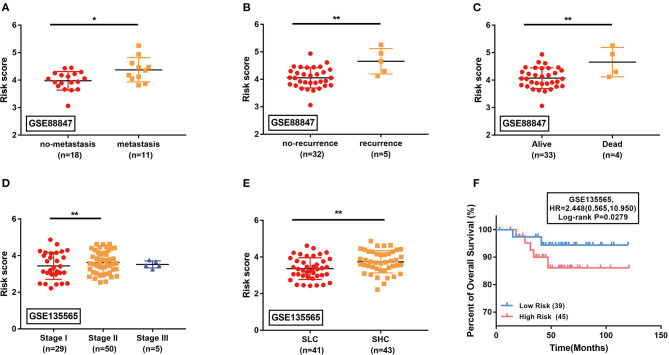
Figure 5.
External validation of the identified signature in GSE88847 (A–C) and GSE135565 (D–F) datasets. (A–E) Comparison of the estimated risk scores in different subgroups. Horizontal line: mean with SD. SLC, standardized uptake value (SUV)-low cluster; SHC, SUV-high cluster. *P < 0.05, **P < 0.01. (F) The Kaplan-Meier survival curves comparing the overall survival between high-risk and low-risk TNBC patients in GSE135565. HR, hazard ratio.

