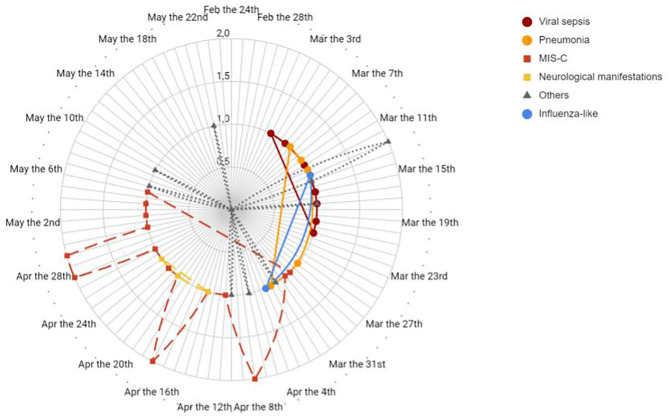
Figure 2.
Timeline distribution of patients divided by clinical pattern of presentation diagnosis. Solid line indicates diagnosis of viral sepsis, pneumonia and influenza like symptoms in different shades of grey. Dashed line indicates diagnosis of MIS-C and neurological manifestations. Dotted line indicates other diagnosis.

