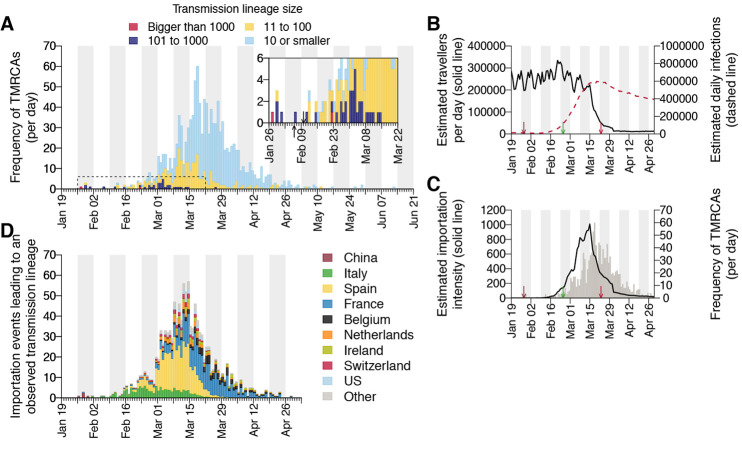
Fig. 5. Dynamics of UK transmission lineage importation.
(A) Histogram of lineage TMRCAs, colored by lineage size. Inset: expanded view of the days prior to UK lockdown. Left-hand arrow = collection date of the UK’s first laboratory-confirmed case; right-hand arrow = collection date of the earliest UK virus genome in our dataset. (B) Estimated number of inbound travellers to the UK per day (black) and estimated number of infectious cases worldwide (dashed red). Arrows here show, from left to right, dates of the first self-isolation advice for returning travellers from China, Italy, and of the start of the UK national lockdown. (C) Estimated importation intensity (EII) curve (black) and the histogram of lineage TMRCAs (grey). (D) Estimated histogram of virus lineage importation events per day, obtained from our lag model. Colors show the proportion attributable each day to inbound travel from various countries (see table S4 and figs. S19 and S20). This assignment is statistical, i.e., we cannot ascribe a specific source location to any given lineage.

