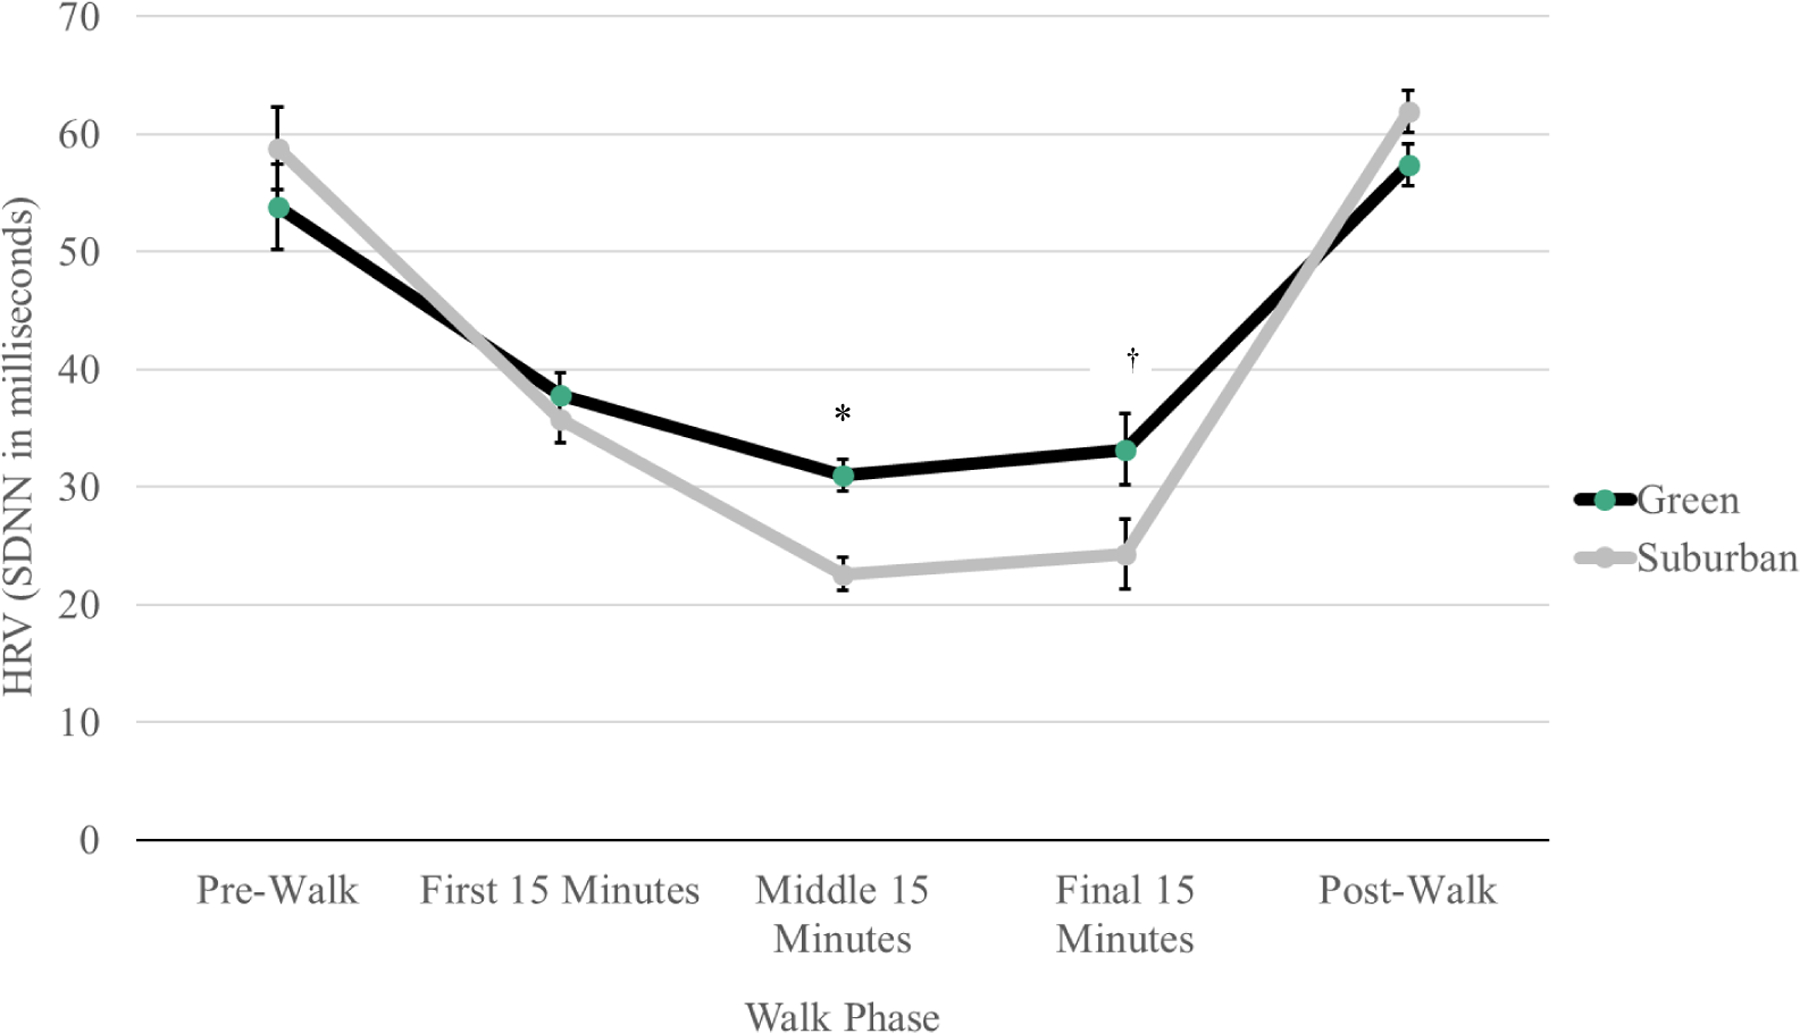
Fig. 3.

Line graph shows average heart rate variability (ms) change across walk phases by green and suburban conditions (n = 23). ≪1.5-column fitting image≫
Note. Data are presented as mean ± SE. Between-condition contrasts, mean (95% CI): pre-walk: −5.0 (−9.9, −0.08); first 15 min: 2.1 (−2.6, 6.8); second 15 min: 8.4 (6.0, 10.9)*; final 15 min: 8.9 (1.2, 16.6) †; post-walk: −4.5 (−8.0, −1.1).
