
Figure 1—
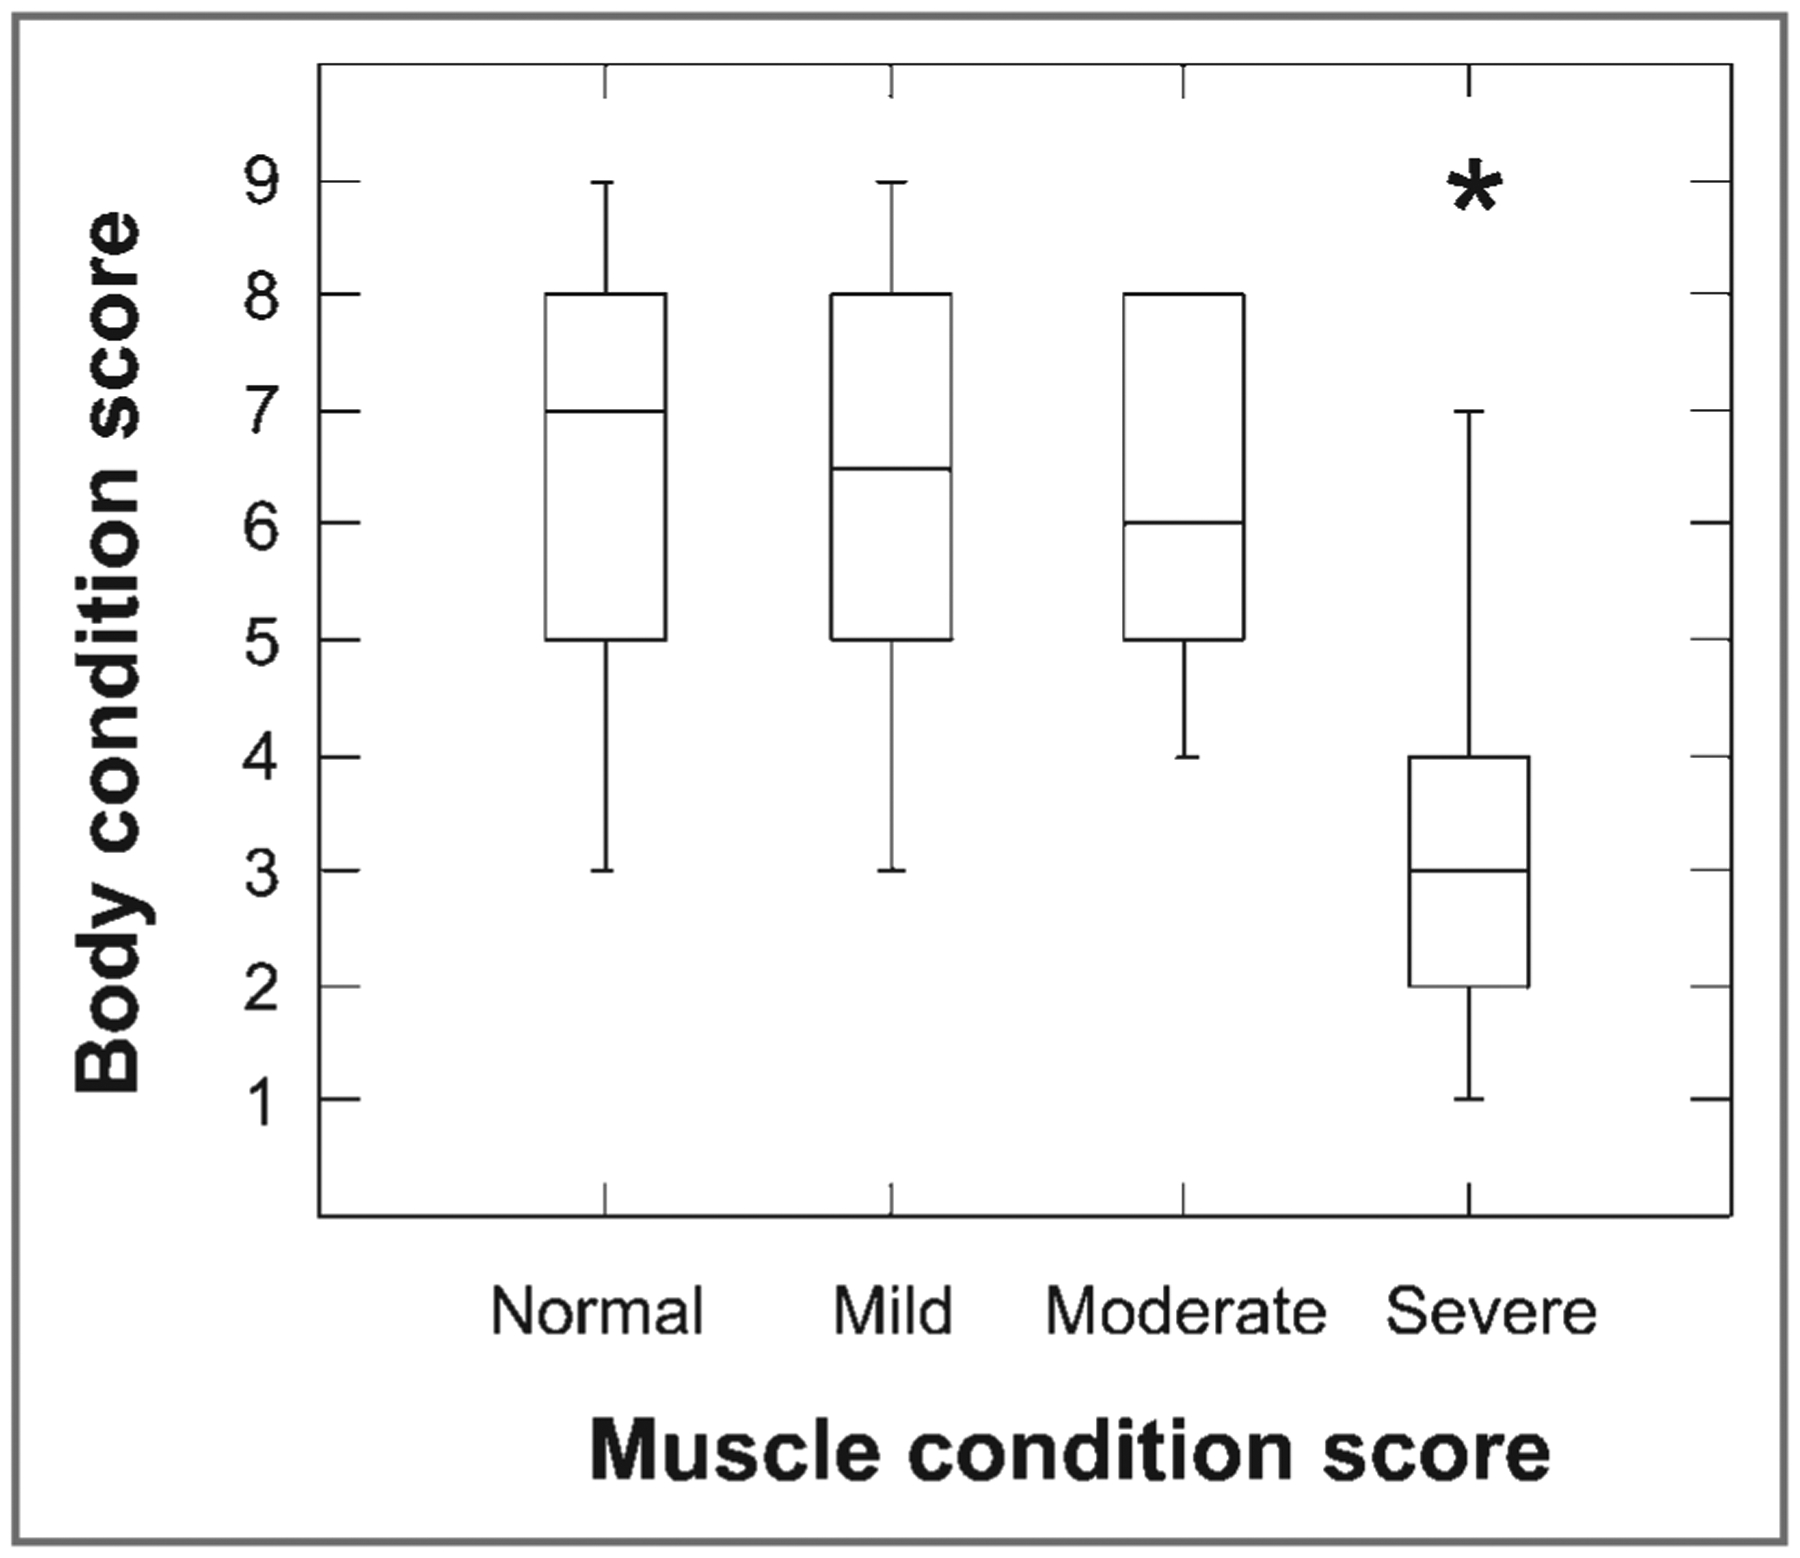
Box plots of BCS as a function of MCS (no [normal], mild, moderate, or severe muscle wasting) in 87 dogs. For each plot, the box represents the central 50% of the values. The horizontal line in each box represents the median, and the bars indicate the median ± 1.5 × interquartile range. *Outlier value (value > 1.5 times interquartile range)