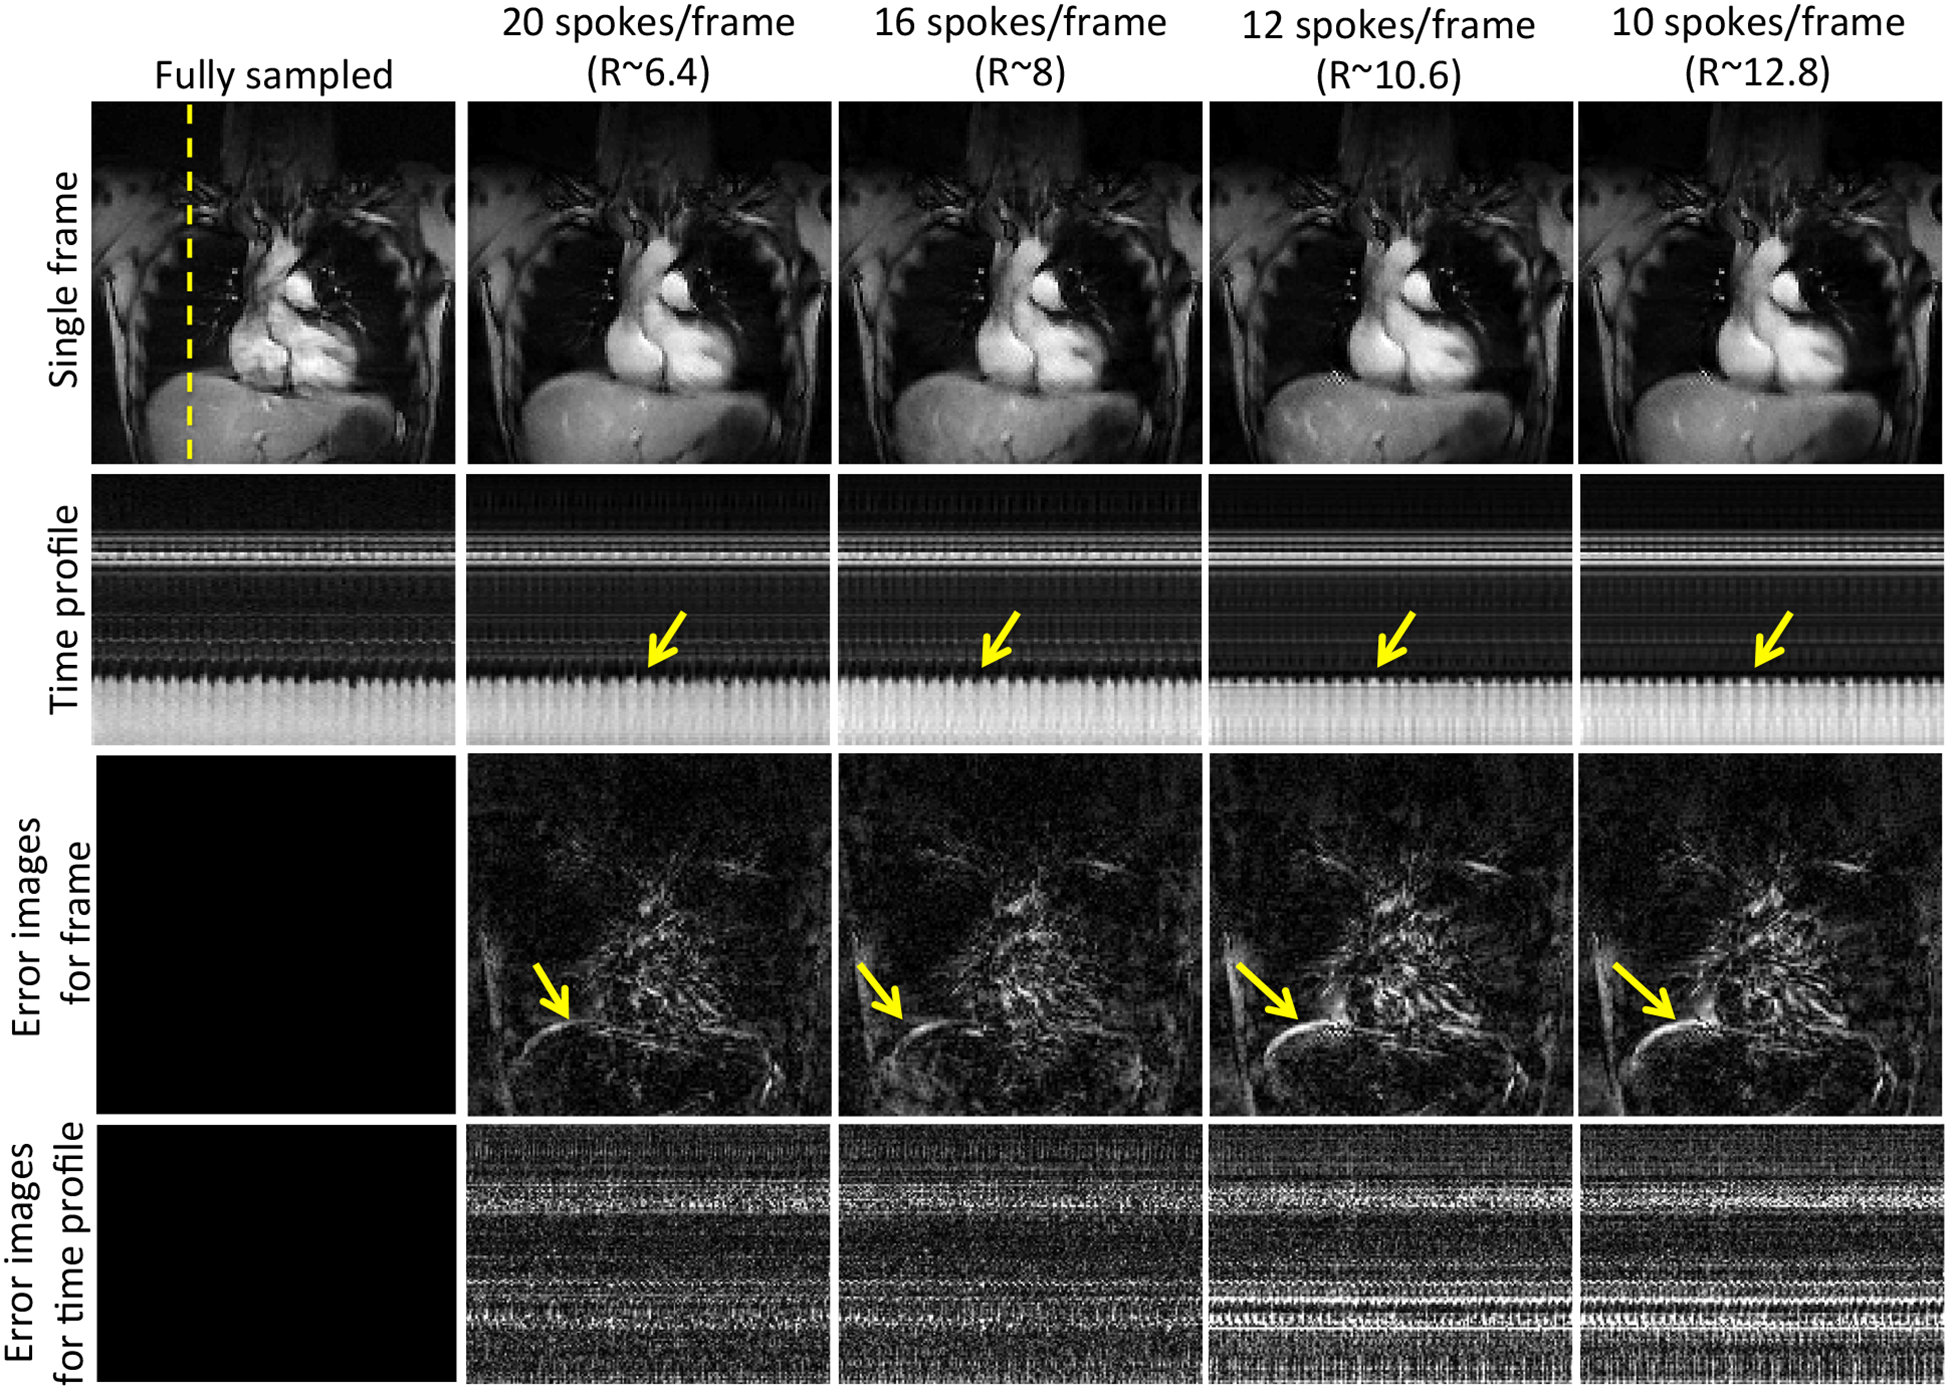
Figure 3:

Performance of the BCS scheme at different acceleration factors: The figure shows the single frame (row 1), the time profiles (row 2) and the corresponding error images (row 3–4) of reconstructions obtained by retrospectively undersampling the dataset with 20, 16, 12, and 10 radial spokes per frames resulting in acceleration factors (R) of 6.4, 8, 10.2, and 12.8 respectively. Reliable reconstructions are achieved up to R=8. Beyond R=8 we begin to observe temporal blurring as shown by the arrows in the error images. Note: All the images are in same scale.
