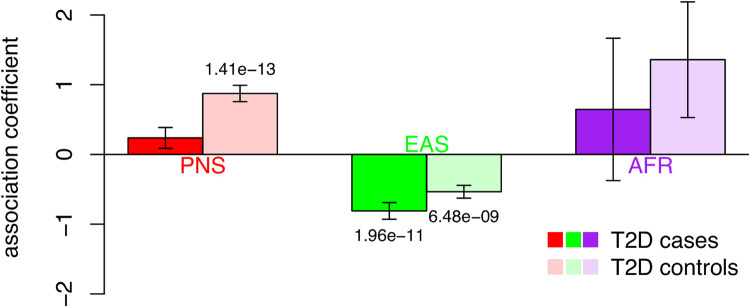
Fig 1. Stratified association testing between global genetic ancestry and BMI.
Individuals were stratified based on T2D disease status. Cases are colored in darker color, controls in lighter color. The association coefficient between ancestry component and BMI within strata are shown (S18 Table). Error bars reflect the estimated standard error from the regression model. P-values for significant association coefficients are labeled. The strongly significant association between PNS ancestry and BMI among T2D controls, but not cases, is suggestive of an interaction between PNS ancestry and T2D.

