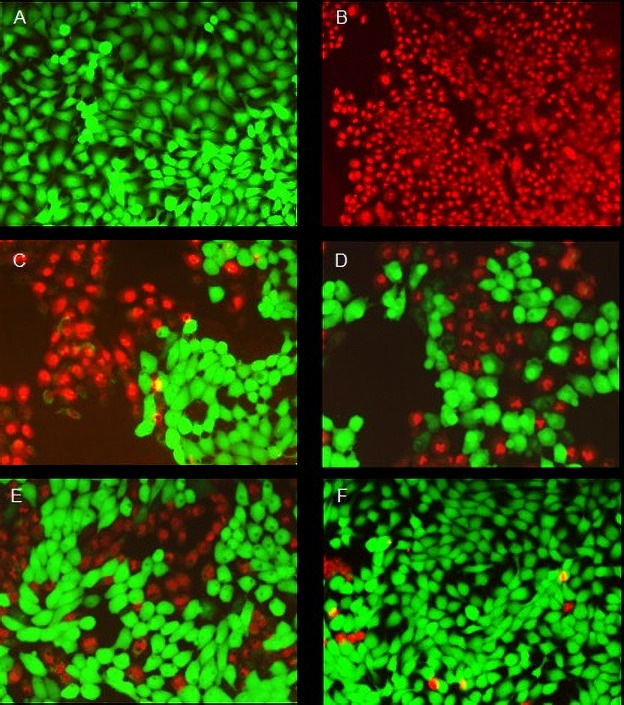
Fig 2. Fluorescence images showing the viability of the HaCaT cells treated with articaine formulations at the IC50 concentration for 1 h at 37°C.
(A) live cells (negative control); (B) dead cells (positive control treated with 70% methanol); treatments with (C) ATC; (D) ATCepi; (E) ATCnano; (F) ATCnanoepi. Each image is composed of two superimposed images taken through different filters for green (calcein) and red (homodimer-1) fluorescence. All images were acquired at the same magnification (10x).

