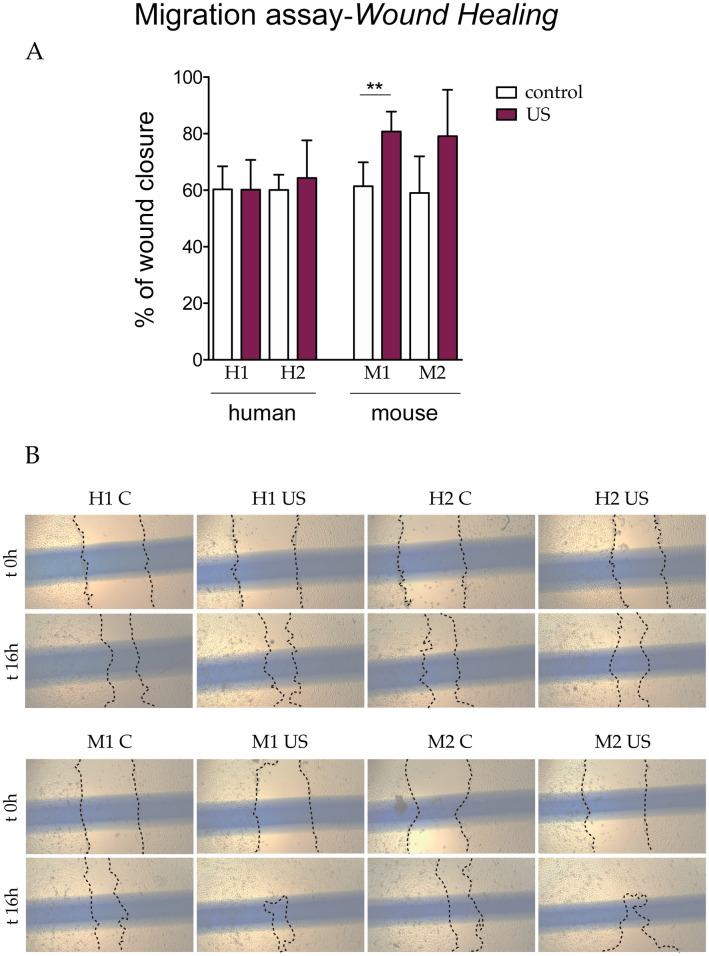
Fig 5. Wound healing migration assay.
(A) Data are shown from a representative experiment out of five performed and denote mean ± SD (quantification at 16 h). Statistical analysis was performed using Student’s t test. **p < 0.01. (B) Representative images of the wound at time 0 h and 16 h after scratching. Shown are two independent samples of mouse (M1 and M2) and human (H1 and H2) s-MPs under control conditions or treated with ultrasound (US).

