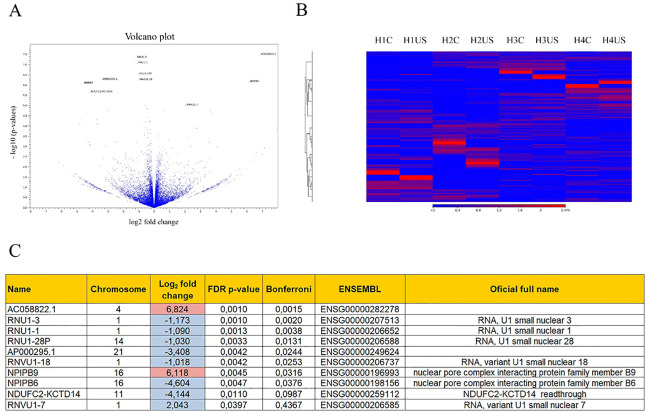
Fig 9. RNA-seq results.
(A) Volcano plot showing the 10 genes differentially expressed between control and ultrasound-stimulated (US) human s-MPs. (B) Heat map graph, where the red zones are correlate with upregulated genes and the blue zones with the absence of changes in expression. (C) Differentially expressed genes that fulfill the conditions to present a p-value under 0.05 and fold change over 2 or under -2.

