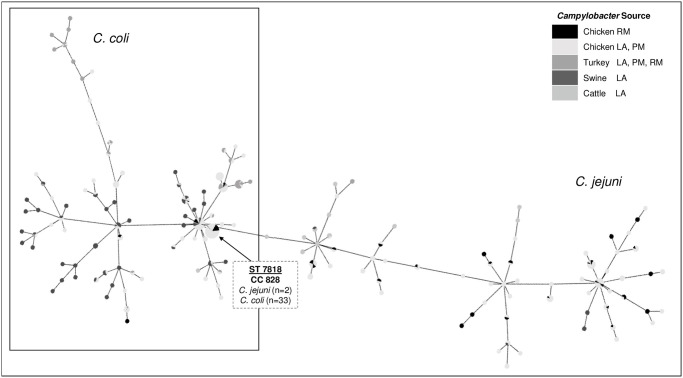
Fig 6. C. coli and C. jejuni MLST minimum spanning tree.
Expansion generated by PHYLOVIZ software using an eBLAST algorithm. Link distances correlate to locus variations and represent the most likely relationship between isolates. Data points are colored by source according to the key. Isolates with unknown alleles were not included in the diagram.

