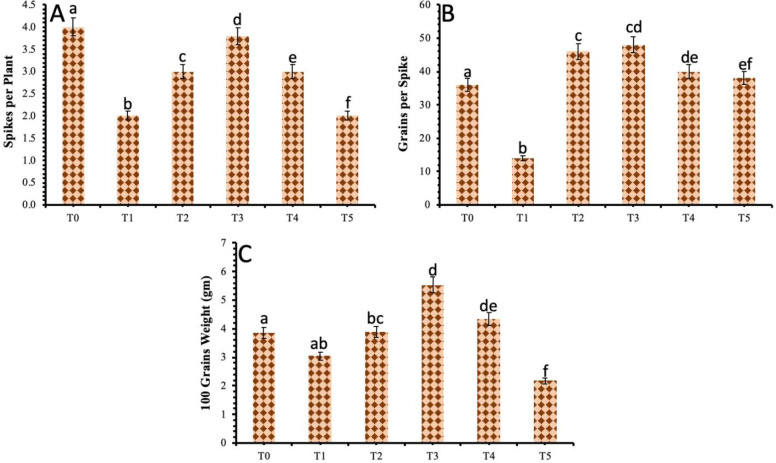
Fig 5.
Effect of different treatments of TiO2 NPs on (a) Spikes per plant (b) Grains per spike and (c) 100 grains weight. Treatment; T0: Healthy Plants, T1: Plants Infected with Pathogen, T2: 20 mg/L, T3: 40 mg/L, T4: 60 mg/L and T5: 80 mg/L. Note: Different alphabets represent that the results are significantly different (p < 0.05).

