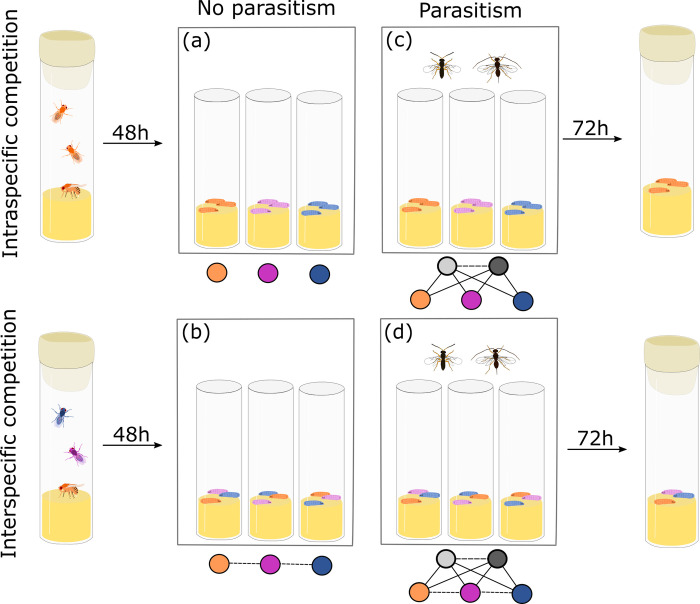
Fig 1. Schematic representation of the steps of the protocol and the experimental treatments.
Orange, pink, and blue nodes represent the three host species, and white and grey nodes represent the two parasitoid species. Solid arrows show possible trophic interactions, and dashed arrows show possible competitive interactions in each treatment. The type of competition between host species (intraspecific/interspecific) and presence or absence of parasitoids in the cages were manipulated in a fully factorial design: a) intraspecific competition, b) interspecific competition, c) intraspecific competition with parasitism, and d) all interactions.

