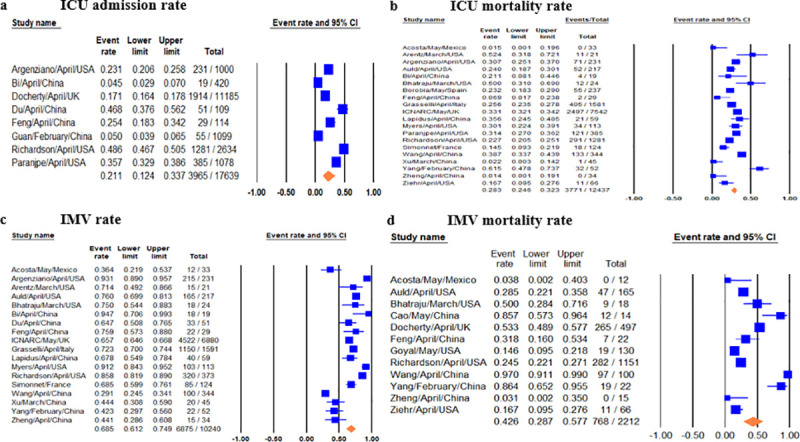
Fig 2. Forest plots of relevant included studies showing pooled event rates of ICU and IMV outcomes.

Forest plots of studies for 2a) ICU admission rates, 2b) ICU mortality rates, 2c) IMV rates, 2d) IMV mortality rates.

Forest plots of studies for 2a) ICU admission rates, 2b) ICU mortality rates, 2c) IMV rates, 2d) IMV mortality rates.