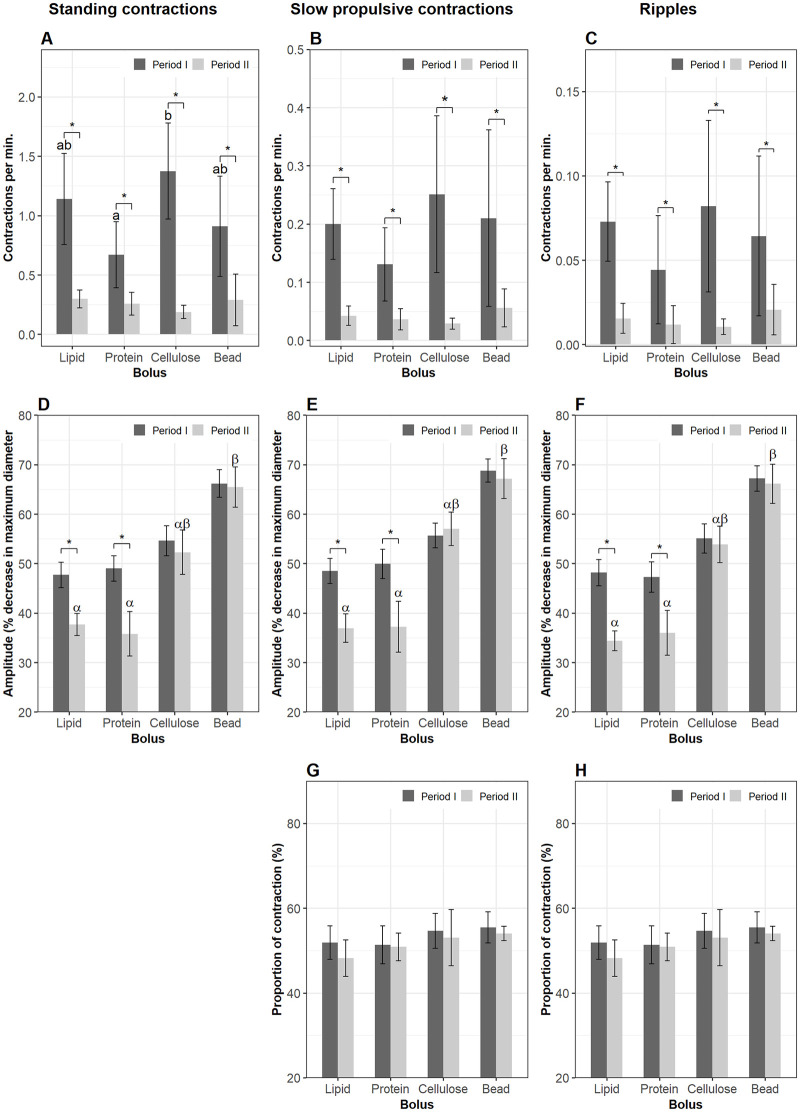
Fig 5. Motility parameters in Segment 3.
Contractions were analyzed in Segment 3 of the intestines when a nutrient bolus (lipid, protein, cellulose or plastic bead) presented (period I) and after the bolus left (period II) Segment 1. Frequency (mean±s.d.) of standing contractions (A), slow propulsive contractions (B) and ripples (C). Amplitude (median±s.e.m.) of standing contractions (D), slow propulsive contractions (E) and ripples (F). Significant differences (p < 0.05) between the four bolus treatments within period I are annotated by Latin letters and differences within period II by Greek letters. Asterisks and brackets show a significant difference (p < 0.05) between periods. Data were analyzed using linear mixed-effects models—lme test followed by Tukey HSD in R for (A–C); Generalized Linear Mixed Models via PQL—glmmPQL test for (D–F), with n = 11 for lipid, n = 12 for protein, n = 6 for cellulose or plastic bead.

