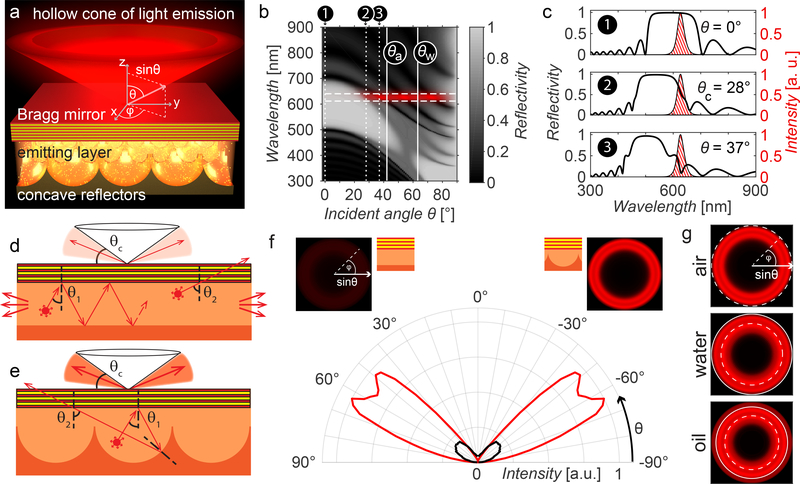
Figure 1: The concept of substrate luminescence-enabled dark-field imaging.
a) 3D schematics of the device design. b) Grey-scale encoded reflectivity of a Bragg mirror with a reflection band centred at 585nm as a function of light incidence angle and wavelength. Solid white vertical lines mark the critical angles θa and θw beyond which total internal reflection occurs if the upper medium is air or water. The spectral emission range of the QDs is marked with horizontal dashed white lines; the red overlay represents the angle ranges at which emitted light can escape from the Bragg reflector. c) Selected spectra from (b) at incidence angles θ = 0°, θc = 28° (where the Bragg reflector exhibits a reflectivity of 50% for the QD’s spectral emission range), and θ = 37°, marked by dotted lines in (b). The QD emission spectrum is represented as the red-hatched area. d) Schematic depicting a possible optical path of a light beam emitted by a QD in the case of a flat bottom reflector. If the light is emitted at an angle θ1 for which it is reflected by the Bragg mirror, the beam will keep bouncing between the two reflective surfaces, until it escapes at the sample edge. For a higher incidence angle θ2 light can couple out. e) In the case of a bottom reflector patterned with semi-spherical cavities, the light emitted at an angle θ1 can – through scattering from the patterned bottom surface – reach an incident angle θ2 large enough to transmit through the Bragg reflector. f) Simulated angular emission profiles comparing the angle-dependent intensity of light emitted by a substrate with flat bottom reflector (black) and a substrate with a micro-patterned bottom reflector (red). The insets show visualizations of the emitted light intensity and colour as a function of the angle of incidence onto the Bragg reflector, which increases from 0º at the images’ centre to 90º at the edges. g) Emission profiles in air, water, and oil. The dashed line corresponds to an output angle of 90˚ in air, while the solid line corresponds to 90˚ in water.

