
FIGURE 4.
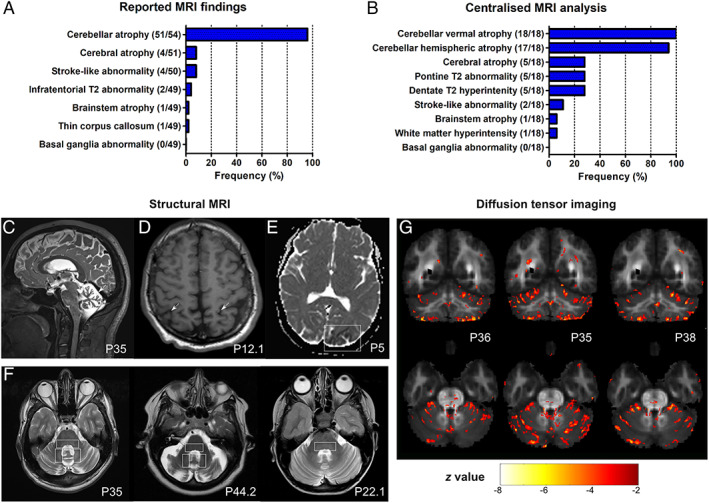
Magnetic resonance imaging (MRI) features of coenzyme COQ8A‐ataxia. (A) Reported MRI findings. Numerator and denominator in brackets indicate the number of patients with a feature and the number of patients assessed for this feature, respectively. (B) Centralized analysis of original MRI images of 18 patients by 2 independent raters. Vermal cerebellar atrophy was universally present. Representative images highlighting cerebellar atrophy (C), cerebral atrophy (D), and stroke‐like abnormalities (E), and infratentorial T2 hyperintensities of the dorsal pons, and dentate nuclei (F) as a novel imaging features of COQ8‐ataxia. (G) Diffusion tensor imaging (DTI) analysis. The z‐map of three individual COQ8A patients (P36, P35, and P38) superimposed on the mean FA map of all controls, depicting voxels with a z‐score less than −2.5 and a cluster size of 30. In all three patients, FA values are reduced in the periphery of the anterior and posterior lobe, the superior cerebellar peduncle and pontine crossing tracts, and diffusely in supratentorial clusters. [Color figure can be viewed at www.annalsofneurology.org]