Figure 1.
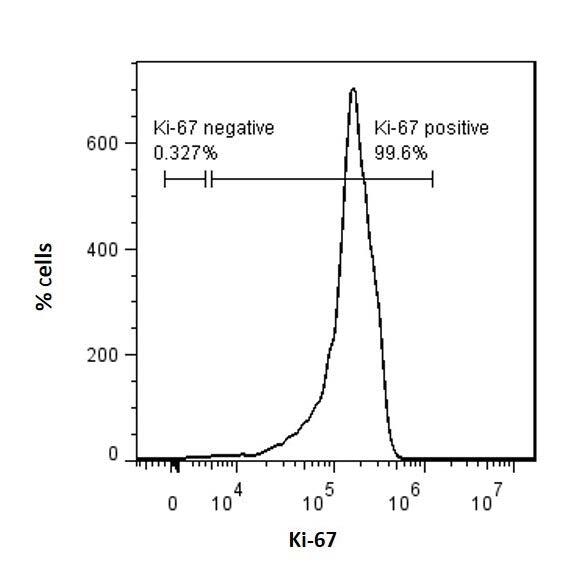
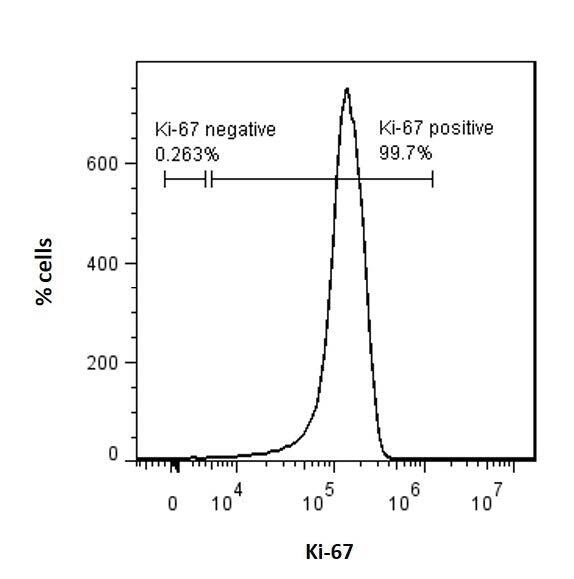
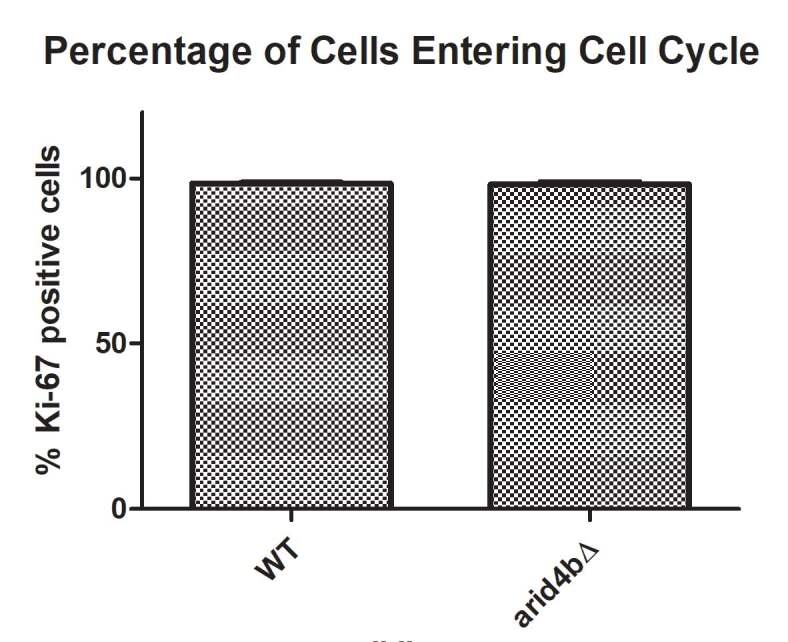
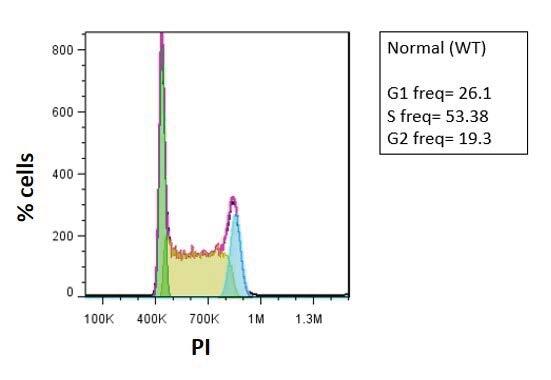
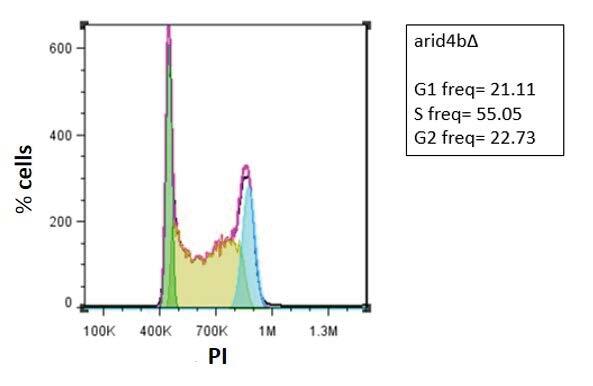
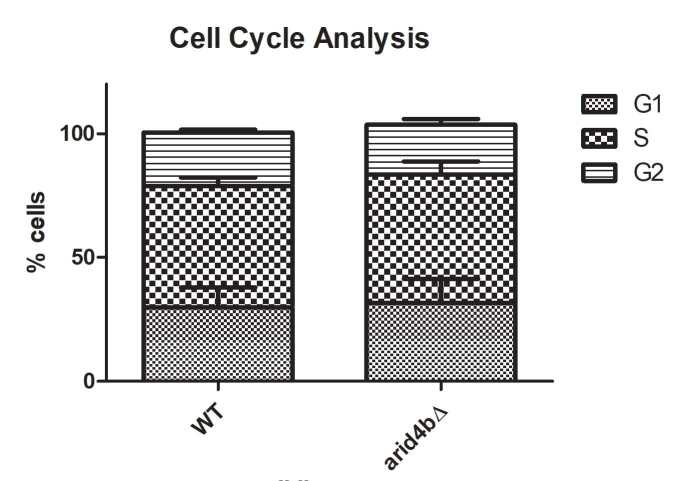
Cell cycle entry and distribution of WT and arid4bΔ mESCs.
FACS histogram of a. wild type (CJ9) b. arid4bΔ mESCs determined by Ki-67-eFluor660 staining. c. Bar graph representation of Ki-67 positive WT and arid4bΔ mESCs. (Unpaired t-test: not significant) d. Cell cycle phase distribution of Ki67-positive WT and arid4bΔ mESCs. Error bars indicates standard error. (Unpaired t-test: not significant)
FlowJo cell cycle analysis of e. WT and f. arid4bΔ mESCs stained with Ki67-FITC and Propidium lodide (PI). Black line represents the experimental analysis, while pink trace is cell cycle fit determined by the FlowJo software cell cycle suite. Green, yellow and blue shaded areas indicate G1, S and G2 phases, respectively.

