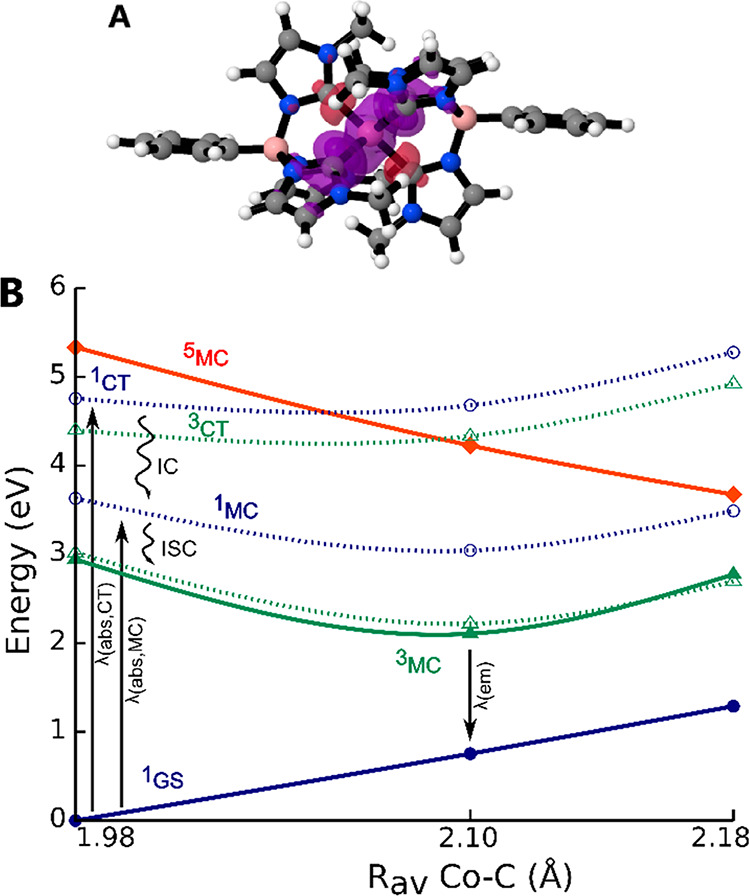
Figure 4.

(A) Spin density plot for the lowest relaxed triplet state. Positive (excess α) and negative (excess β) spin density contributions are shown as purple and red isosurfaces, respectively, Contour of the plot 0.03. (B) Excited-state potential energy landscape, including calculated vertically excited singlet and triplet state energies from TD-DFT with sketched energy surfaces (dashed lines) for visual guidance, as well as singlet, triplet, and quintet unrestricted DFT energies at the lowest computational relaxed singlet, triplet, and quintet geometries with sketched energy surfaces (bold lines). Excitation and decay processes discussed in the text are marked by vertical arrows. IC = internal conversion, and ISC = intersystem crossing.
